|
Download Data (XLS File) |
|
||||||||
|
||||||||
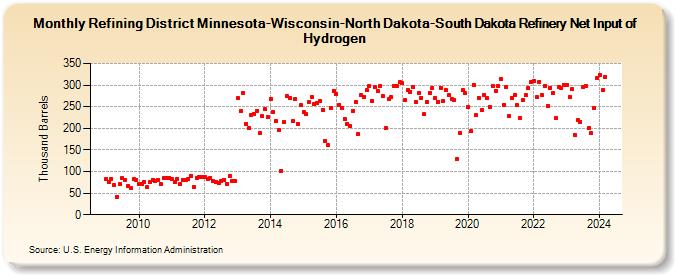
| Refining District Minnesota-Wisconsin-North Dakota-South Dakota Refinery Net Input of Hydrogen (Thousand Barrels) | ||||||||
| Year | Jan | Feb | Mar | Apr | May | Jun | Jul | Aug | Sep | Oct | Nov | Dec |
|---|---|---|---|---|---|---|---|---|---|---|---|---|
| 2009 | 82 | 75 | 83 | 69 | 42 | 71 | 84 | 81 | 67 | 61 | 83 | 81 |
| 2010 | 70 | 71 | 76 | 63 | 75 | 81 | 79 | 81 | 71 | 85 | 85 | 85 |
| 2011 | 82 | 76 | 83 | 71 | 81 | 80 | 82 | 90 | 65 | 85 | 88 | 87 |
| 2012 | 87 | 82 | 85 | 77 | 76 | 74 | 79 | 81 | 72 | 89 | 79 | 78 |
| 2013 | 269 | 240 | 282 | 211 | 200 | 231 | 234 | 241 | 189 | 228 | 244 | 226 |
| 2014 | 267 | 237 | 216 | 196 | 102 | 215 | 274 | 271 | 216 | 268 | 211 | 253 |
| 2015 | 237 | 233 | 261 | 273 | 256 | 259 | 263 | 243 | 171 | 161 | 247 | 287 |
| 2016 | 280 | 254 | 248 | 221 | 210 | 205 | 241 | 262 | 187 | 276 | 273 | 288 |
| 2017 | 298 | 264 | 296 | 286 | 298 | 274 | 201 | 267 | 272 | 299 | 298 | 306 |
| 2018 | 305 | 266 | 288 | 285 | 296 | 262 | 282 | 271 | 233 | 261 | 282 | 294 |
| 2019 | 270 | 262 | 294 | 263 | 288 | 277 | 268 | 266 | 128 | 190 | 288 | 281 |
| 2020 | 249 | 193 | 301 | 230 | 271 | 243 | 277 | 270 | 250 | 298 | 287 | 297 |
| 2021 | 313 | 255 | 296 | 228 | 271 | 278 | 253 | 224 | 265 | 276 | 293 | 308 |
| 2022 | 310 | 273 | 308 | 276 | 298 | 252 | 294 | 281 | 223 | 296 | 294 | 301 |
| 2023 | 301 | 273 | 290 | 184 | 219 | 215 | 296 | 299 | 200 | 189 | 246 | 317 |
| 2024 | 324 | 288 | 319 | 240 | 294 | 275 | ||||||
| - = No Data Reported; -- = Not Applicable; NA = Not Available; W = Withheld to avoid disclosure of individual company data. |
| Release Date: 8/30/2024 |
| Next Release Date: 9/30/2024 |