|
Download Data (XLS File) |
|
||||||||
|
||||||||
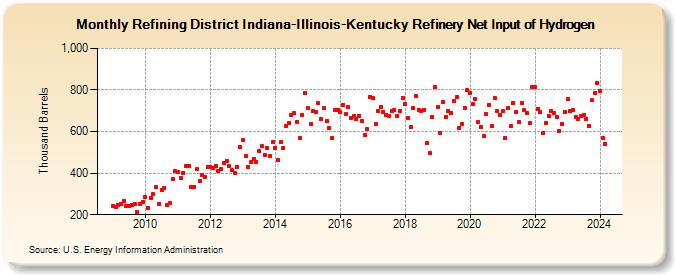
| Refining District Indiana-Illinois-Kentucky Refinery Net Input of Hydrogen (Thousand Barrels) | ||||||||
| Year | Jan | Feb | Mar | Apr | May | Jun | Jul | Aug | Sep | Oct | Nov | Dec |
|---|---|---|---|---|---|---|---|---|---|---|---|---|
| 2009 | 241 | 238 | 247 | 253 | 266 | 243 | 241 | 248 | 250 | 211 | 253 | 263 |
| 2010 | 283 | 234 | 281 | 300 | 331 | 253 | 319 | 329 | 245 | 255 | 372 | 410 |
| 2011 | 406 | 375 | 401 | 432 | 435 | 331 | 335 | 420 | 364 | 389 | 381 | 430 |
| 2012 | 430 | 424 | 434 | 411 | 421 | 450 | 458 | 432 | 413 | 402 | 431 | 526 |
| 2013 | 561 | 482 | 431 | 452 | 470 | 455 | 507 | 529 | 488 | 520 | 481 | 548 |
| 2014 | 523 | 464 | 548 | 521 | 627 | 640 | 681 | 688 | 647 | 571 | 680 | 787 |
| 2015 | 714 | 636 | 698 | 693 | 735 | 660 | 711 | 649 | 617 | 571 | 703 | 705 |
| 2016 | 692 | 726 | 685 | 717 | 665 | 676 | 658 | 677 | 651 | 585 | 611 | 768 |
| 2017 | 762 | 637 | 697 | 717 | 696 | 681 | 675 | 699 | 705 | 673 | 699 | 762 |
| 2018 | 731 | 663 | 621 | 713 | 769 | 702 | 700 | 706 | 544 | 496 | 670 | 813 |
| 2019 | 719 | 591 | 743 | 671 | 698 | 691 | 748 | 766 | 618 | 638 | 714 | 799 |
| 2020 | 787 | 734 | 756 | 647 | 621 | 578 | 683 | 730 | 629 | 762 | 697 | 681 |
| 2021 | 697 | 571 | 714 | 625 | 739 | 693 | 645 | 735 | 702 | 687 | 639 | 815 |
| 2022 | 813 | 710 | 692 | 593 | 640 | 676 | 701 | 689 | 668 | 604 | 637 | 696 |
| 2023 | 755 | 698 | 704 | 670 | 661 | 673 | 682 | 662 | 628 | 750 | 784 | 833 |
| 2024 | 796 | 570 | 542 | 666 | 775 | 689 | ||||||
| - = No Data Reported; -- = Not Applicable; NA = Not Available; W = Withheld to avoid disclosure of individual company data. |
| Release Date: 8/30/2024 |
| Next Release Date: 9/30/2024 |