|
Download Data (XLS File) |
|
||||||||
|
||||||||
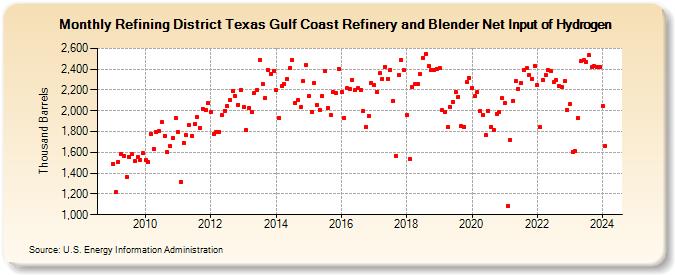
| Refining District Texas Gulf Coast Refinery and Blender Net Input of Hydrogen (Thousand Barrels) | ||||||||
| Year | Jan | Feb | Mar | Apr | May | Jun | Jul | Aug | Sep | Oct | Nov | Dec |
|---|---|---|---|---|---|---|---|---|---|---|---|---|
| 2009 | 1,492 | 1,215 | 1,508 | 1,584 | 1,569 | 1,362 | 1,555 | 1,584 | 1,516 | 1,554 | 1,525 | 1,593 |
| 2010 | 1,527 | 1,507 | 1,776 | 1,633 | 1,793 | 1,802 | 1,893 | 1,762 | 1,599 | 1,660 | 1,742 | 1,935 |
| 2011 | 1,797 | 1,319 | 1,694 | 1,764 | 1,860 | 1,762 | 1,873 | 1,939 | 1,837 | 2,021 | 2,006 | 2,071 |
| 2012 | 1,990 | 1,780 | 1,797 | 1,798 | 1,955 | 2,001 | 2,047 | 2,103 | 2,186 | 2,140 | 2,059 | 2,199 |
| 2013 | 2,033 | 1,814 | 2,028 | 1,986 | 2,174 | 2,202 | 2,490 | 2,253 | 2,121 | 2,396 | 2,352 | 2,385 |
| 2014 | 2,196 | 1,935 | 2,235 | 2,254 | 2,308 | 2,411 | 2,486 | 2,071 | 2,102 | 2,032 | 2,286 | 2,441 |
| 2015 | 2,141 | 1,990 | 2,270 | 2,055 | 2,009 | 2,143 | 2,386 | 2,026 | 1,964 | 2,182 | 2,169 | 2,405 |
| 2016 | 2,185 | 1,933 | 2,216 | 2,205 | 2,300 | 2,196 | 2,215 | 2,200 | 1,996 | 1,847 | 1,951 | 2,269 |
| 2017 | 2,246 | 2,185 | 2,359 | 2,306 | 2,425 | 2,308 | 2,396 | 2,091 | 1,569 | 2,343 | 2,491 | 2,389 |
| 2018 | 1,955 | 1,533 | 2,225 | 2,259 | 2,260 | 2,351 | 2,508 | 2,549 | 2,428 | 2,393 | 2,391 | 2,401 |
| 2019 | 2,411 | 2,004 | 1,984 | 1,840 | 2,040 | 2,082 | 2,178 | 2,137 | 1,855 | 1,848 | 2,276 | 2,317 |
| 2020 | 2,217 | 2,140 | 2,179 | 1,993 | 1,962 | 1,763 | 2,002 | 1,848 | 1,814 | 1,973 | 1,990 | 2,121 |
| 2021 | 2,072 | 1,088 | 1,721 | 2,098 | 2,286 | 2,214 | 2,263 | 2,394 | 2,407 | 2,344 | 2,310 | 2,431 |
| 2022 | 2,244 | 1,841 | 2,297 | 2,345 | 2,392 | 2,384 | 2,274 | 2,292 | 2,236 | 2,232 | 2,284 | 2,012 |
| 2023 | 2,062 | 1,606 | 1,612 | 1,928 | 2,474 | 2,485 | 2,471 | 2,532 | 2,417 | 2,428 | 2,425 | 2,420 |
| 2024 | 2,047 | |||||||||||
| - = No Data Reported; -- = Not Applicable; NA = Not Available; W = Withheld to avoid disclosure of individual company data. |
| Release Date: 3/29/2024 |
| Next Release Date: 4/30/2024 |