|
Download Data (XLS File) |
|
||||||||
|
||||||||
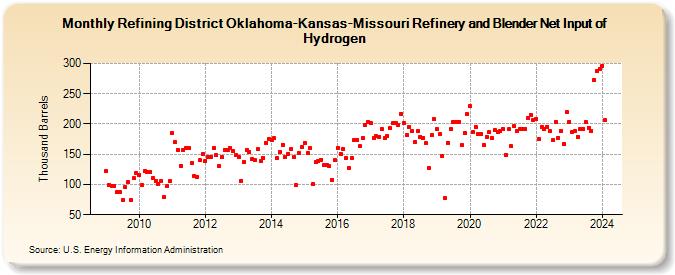
| Refining District Oklahoma-Kansas-Missouri Refinery and Blender Net Input of Hydrogen (Thousand Barrels) | ||||||||
| Year | Jan | Feb | Mar | Apr | May | Jun | Jul | Aug | Sep | Oct | Nov | Dec |
|---|---|---|---|---|---|---|---|---|---|---|---|---|
| 2009 | 122 | 99 | 98 | 98 | 87 | 87 | 74 | 95 | 104 | 74 | 110 | 119 |
| 2010 | 116 | 99 | 122 | 120 | 121 | 111 | 106 | 100 | 105 | 79 | 97 | 105 |
| 2011 | 185 | 170 | 157 | 131 | 157 | 160 | 161 | 135 | 114 | 113 | 140 | 150 |
| 2012 | 139 | 145 | 145 | 160 | 148 | 130 | 145 | 157 | 157 | 161 | 155 | 149 |
| 2013 | 146 | 106 | 137 | 157 | 153 | 142 | 140 | 158 | 138 | 144 | 169 | 175 |
| 2014 | 174 | 176 | 144 | 153 | 166 | 146 | 150 | 158 | 145 | 99 | 152 | 162 |
| 2015 | 169 | 152 | 160 | 100 | 137 | 138 | 141 | 132 | 132 | 130 | 108 | 140 |
| 2016 | 161 | 151 | 158 | 144 | 127 | 144 | 173 | 173 | 163 | 177 | 199 | 204 |
| 2017 | 201 | 177 | 180 | 179 | 191 | 177 | 180 | 193 | 201 | 202 | 199 | 217 |
| 2018 | 202 | 182 | 195 | 188 | 170 | 188 | 179 | 177 | 168 | 127 | 181 | 208 |
| 2019 | 191 | 183 | 147 | 77 | 169 | 191 | 203 | 203 | 204 | 165 | 185 | 216 |
| 2020 | 230 | 186 | 195 | 183 | 183 | 165 | 179 | 186 | 177 | 190 | 187 | 188 |
| 2021 | 191 | 149 | 191 | 163 | 196 | 189 | 191 | 191 | 192 | 210 | 215 | 206 |
| 2022 | 209 | 175 | 195 | 191 | 195 | 188 | 173 | 204 | 177 | 189 | 167 | 219 |
| 2023 | 204 | 187 | 188 | 179 | 192 | 192 | 203 | 194 | 188 | 273 | 287 | 291 |
| 2024 | 296 | |||||||||||
| - = No Data Reported; -- = Not Applicable; NA = Not Available; W = Withheld to avoid disclosure of individual company data. |
| Release Date: 3/29/2024 |
| Next Release Date: 4/30/2024 |