|
Download Data (XLS File) |
|
||||||||
|
||||||||
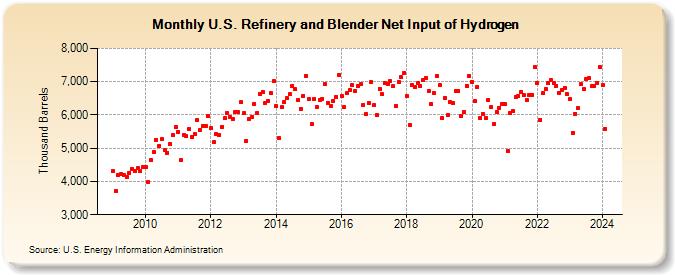
| U.S. Refinery and Blender Net Input of Hydrogen (Thousand Barrels) | ||||||||
| Year | Jan | Feb | Mar | Apr | May | Jun | Jul | Aug | Sep | Oct | Nov | Dec |
|---|---|---|---|---|---|---|---|---|---|---|---|---|
| 2009 | 4,309 | 3,714 | 4,180 | 4,215 | 4,191 | 4,141 | 4,261 | 4,383 | 4,314 | 4,394 | 4,306 | 4,431 |
| 2010 | 4,429 | 3,983 | 4,650 | 4,884 | 5,252 | 5,066 | 5,270 | 4,933 | 4,864 | 5,126 | 5,402 | 5,636 |
| 2011 | 5,495 | 4,639 | 5,392 | 5,358 | 5,581 | 5,324 | 5,429 | 5,853 | 5,547 | 5,657 | 5,675 | 5,957 |
| 2012 | 5,593 | 5,177 | 5,424 | 5,395 | 5,647 | 5,896 | 6,062 | 5,940 | 5,880 | 6,077 | 6,082 | 6,374 |
| 2013 | 6,048 | 5,209 | 5,883 | 5,942 | 6,335 | 6,059 | 6,637 | 6,683 | 6,353 | 6,414 | 6,648 | 7,006 |
| 2014 | 6,268 | 5,303 | 6,234 | 6,395 | 6,508 | 6,624 | 6,881 | 6,769 | 6,451 | 6,191 | 6,581 | 7,184 |
| 2015 | 6,465 | 5,724 | 6,473 | 6,252 | 6,444 | 6,488 | 6,923 | 6,371 | 6,262 | 6,430 | 6,549 | 7,208 |
| 2016 | 6,559 | 6,228 | 6,655 | 6,739 | 6,892 | 6,722 | 6,867 | 6,919 | 6,305 | 6,022 | 6,370 | 6,987 |
| 2017 | 6,287 | 5,997 | 6,789 | 6,617 | 6,946 | 6,924 | 7,007 | 6,866 | 6,279 | 6,994 | 7,132 | 7,253 |
| 2018 | 6,572 | 5,692 | 6,885 | 6,825 | 6,950 | 6,874 | 7,048 | 7,116 | 6,731 | 6,328 | 6,652 | 7,174 |
| 2019 | 6,901 | 5,914 | 6,520 | 5,990 | 6,382 | 6,369 | 6,714 | 6,715 | 5,962 | 6,073 | 6,882 | 7,178 |
| 2020 | 6,993 | 6,404 | 6,852 | 5,897 | 6,040 | 5,910 | 6,450 | 6,228 | 5,741 | 6,098 | 6,217 | 6,331 |
| 2021 | 6,328 | 4,929 | 6,055 | 6,128 | 6,548 | 6,568 | 6,683 | 6,584 | 6,438 | 6,608 | 6,608 | 7,441 |
| 2022 | 6,956 | 5,859 | 6,655 | 6,781 | 6,950 | 7,045 | 6,950 | 6,881 | 6,670 | 6,747 | 6,811 | 6,614 |
| 2023 | 6,478 | 5,469 | 6,041 | 6,199 | 6,915 | 6,777 | 7,087 | 7,099 | 6,874 | 6,882 | 6,967 | 7,432 |
| 2024 | 6,892 | |||||||||||
| - = No Data Reported; -- = Not Applicable; NA = Not Available; W = Withheld to avoid disclosure of individual company data. |
| Release Date: 3/29/2024 |
| Next Release Date: 4/30/2024 |