|
Download Data (XLS File) |
|
||||||||
|
||||||||
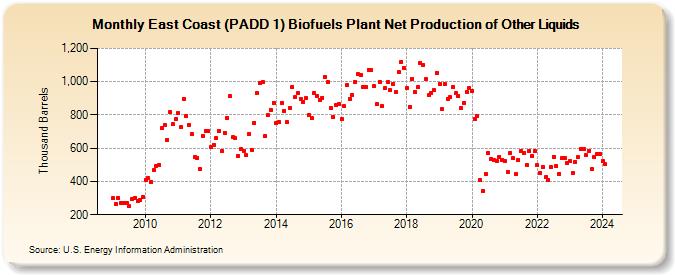
| East Coast (PADD 1) Biofuels Plant Net Production of Other Liquids (Thousand Barrels) | ||||||||
| Year | Jan | Feb | Mar | Apr | May | Jun | Jul | Aug | Sep | Oct | Nov | Dec |
|---|---|---|---|---|---|---|---|---|---|---|---|---|
| 2009 | 298 | 267 | 299 | 270 | 271 | 272 | 250 | 292 | 303 | 282 | 288 | 306 |
| 2010 | 409 | 418 | 399 | 468 | 494 | 499 | 722 | 740 | 652 | 819 | 743 | 773 |
| 2011 | 812 | 725 | 896 | 793 | 740 | 685 | 545 | 542 | 474 | 675 | 704 | 704 |
| 2012 | 607 | 622 | 661 | 706 | 582 | 693 | 782 | 912 | 665 | 659 | 555 | 594 |
| 2013 | 585 | 557 | 686 | 591 | 753 | 929 | 991 | 995 | 672 | 797 | 830 | 872 |
| 2014 | 754 | 759 | 872 | 825 | 755 | 843 | 968 | 905 | 931 | 898 | 880 | 900 |
| 2015 | 801 | 779 | 932 | 913 | 892 | 903 | 1,028 | 995 | 839 | 785 | 861 | 864 |
| 2016 | 774 | 852 | 981 | 896 | 919 | 998 | 1,045 | 1,043 | 967 | 969 | 1,073 | 1,070 |
| 2017 | 971 | 863 | 999 | 853 | 959 | 996 | 947 | 988 | 936 | 1,058 | 1,120 | 1,083 |
| 2018 | 960 | 850 | 1,018 | 940 | 965 | 1,113 | 1,103 | 1,013 | 918 | 934 | 949 | 1,055 |
| 2019 | 984 | 834 | 984 | 898 | 906 | 969 | 929 | 915 | 843 | 874 | 935 | 959 |
| 2020 | 945 | 777 | 795 | 408 | 345 | 447 | 572 | 534 | 527 | 524 | 546 | 530 |
| 2021 | 524 | 454 | 573 | 540 | 442 | 528 | 583 | 574 | 498 | 585 | 556 | 581 |
| 2022 | 496 | 452 | 488 | 425 | 408 | 488 | 550 | 492 | 445 | 538 | 541 | 512 |
| 2023 | 523 | 452 | 518 | 544 | 598 | 595 | 557 | 586 | 474 | 547 | 567 | 565 |
| 2024 | 522 | |||||||||||
| - = No Data Reported; -- = Not Applicable; NA = Not Available; W = Withheld to avoid disclosure of individual company data. |
| Release Date: 3/29/2024 |
| Next Release Date: 4/30/2024 |