|
Download Data (XLS File) |
|
||||||||
|
||||||||
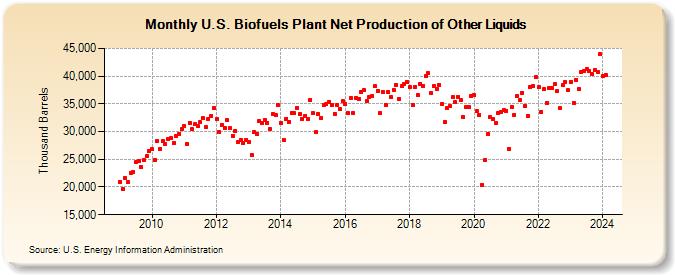
| U.S. Biofuels Plant Net Production of Other Liquids (Thousand Barrels) | ||||||||
| Year | Jan | Feb | Mar | Apr | May | Jun | Jul | Aug | Sep | Oct | Nov | Dec |
|---|---|---|---|---|---|---|---|---|---|---|---|---|
| 2009 | 20,949 | 19,608 | 21,647 | 20,859 | 22,602 | 22,686 | 24,453 | 24,756 | 23,604 | 24,847 | 25,505 | 26,538 |
| 2010 | 26,777 | 24,957 | 28,294 | 26,855 | 28,209 | 27,680 | 28,627 | 28,783 | 27,967 | 29,217 | 29,604 | 30,395 |
| 2011 | 31,023 | 27,746 | 31,593 | 30,372 | 31,313 | 30,977 | 31,662 | 32,418 | 30,857 | 32,261 | 32,860 | 34,246 |
| 2012 | 32,261 | 29,919 | 31,246 | 30,563 | 32,033 | 30,585 | 29,274 | 30,108 | 28,100 | 28,460 | 27,921 | 28,544 |
| 2013 | 28,133 | 25,801 | 29,957 | 29,644 | 31,883 | 31,513 | 32,164 | 31,613 | 30,444 | 33,131 | 33,025 | 34,722 |
| 2014 | 31,587 | 28,503 | 32,354 | 31,752 | 33,336 | 33,257 | 34,279 | 33,098 | 32,287 | 32,859 | 32,311 | 35,751 |
| 2015 | 33,293 | 29,872 | 33,178 | 32,478 | 34,862 | 34,954 | 35,380 | 34,714 | 33,227 | 34,774 | 34,089 | 35,457 |
| 2016 | 34,986 | 33,307 | 36,120 | 33,375 | 36,107 | 35,955 | 37,160 | 37,440 | 35,545 | 36,316 | 36,401 | 38,162 |
| 2017 | 37,386 | 33,383 | 37,155 | 34,807 | 37,116 | 36,262 | 37,553 | 38,442 | 35,932 | 38,174 | 38,549 | 38,977 |
| 2018 | 38,014 | 34,820 | 38,104 | 36,618 | 38,623 | 38,259 | 39,972 | 40,493 | 36,875 | 38,251 | 37,677 | 38,406 |
| 2019 | 35,025 | 31,702 | 34,211 | 34,600 | 36,143 | 35,264 | 36,313 | 35,629 | 32,605 | 34,372 | 34,387 | 36,433 |
| 2020 | 36,537 | 33,645 | 32,998 | 20,425 | 24,786 | 29,548 | 32,556 | 32,291 | 31,567 | 33,356 | 33,534 | 33,868 |
| 2021 | 33,755 | 26,913 | 34,432 | 33,046 | 36,461 | 35,617 | 37,016 | 34,585 | 32,827 | 37,966 | 38,220 | 39,773 |
| 2022 | 37,987 | 33,616 | 37,616 | 35,137 | 37,841 | 37,866 | 38,512 | 37,318 | 34,159 | 38,461 | 38,931 | 37,435 |
| 2023 | 38,987 | 35,184 | 39,386 | 37,632 | 40,680 | 40,880 | 41,200 | 40,913 | 40,297 | 41,097 | 40,751 | 43,961 |
| 2024 | 39,945 | |||||||||||
| - = No Data Reported; -- = Not Applicable; NA = Not Available; W = Withheld to avoid disclosure of individual company data. |
| Release Date: 3/29/2024 |
| Next Release Date: 4/30/2024 |
Referring Pages: