|
Download Data (XLS File) |
|
||||||||
|
||||||||
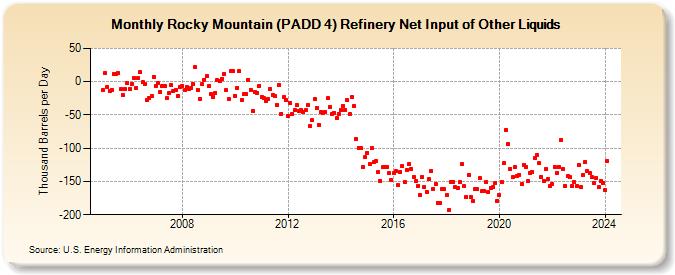
| Rocky Mountain (PADD 4) Refinery Net Input of Other Liquids (Thousand Barrels per Day) | ||||||||
| Year | Jan | Feb | Mar | Apr | May | Jun | Jul | Aug | Sep | Oct | Nov | Dec |
|---|---|---|---|---|---|---|---|---|---|---|---|---|
| 2005 | -13 | 13 | -8 | -14 | -12 | 12 | 12 | 13 | -11 | -20 | -11 | -2 |
| 2006 | -11 | -4 | 6 | -9 | 5 | 14 | -1 | -3 | -28 | -24 | -22 | 7 |
| 2007 | -6 | -2 | -15 | -6 | -7 | -25 | -17 | -5 | -14 | -13 | -22 | -8 |
| 2008 | -6 | -13 | -8 | -11 | -9 | -4 | 22 | -12 | -26 | -4 | 3 | 8 |
| 2009 | -6 | -19 | -23 | -17 | 2 | 1 | 4 | 12 | -13 | -26 | 16 | 16 |
| 2010 | -21 | -9 | 16 | -27 | -19 | -18 | 3 | -12 | -44 | -15 | -17 | -6 |
| 2011 | -23 | -25 | -29 | -26 | -11 | -20 | -21 | -35 | -5 | -48 | -23 | -28 |
| 2012 | -51 | -32 | -48 | -43 | -35 | -44 | -42 | -46 | -43 | -35 | -67 | -58 |
| 2013 | -26 | -39 | -65 | -45 | -47 | -46 | -25 | -38 | -48 | -47 | -55 | -48 |
| 2014 | -43 | -36 | -42 | -28 | -49 | -23 | -36 | -86 | -99 | -100 | -128 | -114 |
| 2015 | -107 | -124 | -100 | -121 | -119 | -136 | -149 | -129 | -129 | -128 | -138 | -148 |
| 2016 | -138 | -135 | -156 | -136 | -127 | -151 | -133 | -124 | -131 | -143 | -150 | -157 |
| 2017 | -170 | -143 | -159 | -166 | -147 | -135 | -161 | -154 | -182 | -183 | -162 | -162 |
| 2018 | -171 | -193 | -151 | -151 | -159 | -160 | -151 | -124 | -157 | -174 | -140 | -174 |
| 2019 | -180 | -161 | -162 | -145 | -165 | -164 | -151 | -166 | -160 | -159 | -153 | -179 |
| 2020 | -170 | -151 | -123 | -72 | -94 | -131 | -144 | -129 | -142 | -140 | -154 | -125 |
| 2021 | -128 | -150 | -137 | -136 | -115 | -110 | -123 | -143 | -149 | -131 | -147 | -157 |
| 2022 | -154 | -128 | -137 | -128 | -88 | -132 | -157 | -142 | -144 | -157 | -151 | -157 |
| 2023 | -125 | -159 | -140 | -121 | -135 | -138 | -143 | -153 | -145 | -159 | -149 | -152 |
| 2024 | -163 | -119 | ||||||||||
| - = No Data Reported; -- = Not Applicable; NA = Not Available; W = Withheld to avoid disclosure of individual company data. |
| Release Date: 4/30/2024 |
| Next Release Date: 5/31/2024 |
Referring Pages: