|
Download Data (XLS File) |
|
||||||||
|
||||||||
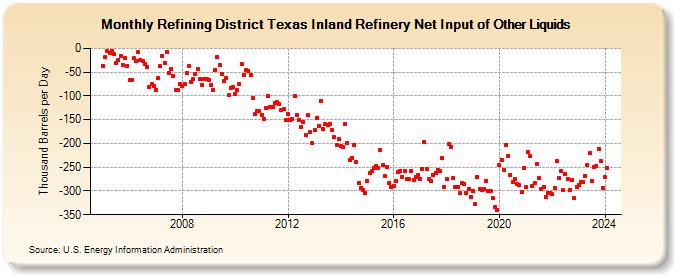
| Refining District Texas Inland Refinery Net Input of Other Liquids (Thousand Barrels per Day) | ||||||||
| Year | Jan | Feb | Mar | Apr | May | Jun | Jul | Aug | Sep | Oct | Nov | Dec |
|---|---|---|---|---|---|---|---|---|---|---|---|---|
| 2005 | -37 | -19 | -5 | -10 | -6 | -12 | -30 | -24 | -16 | -34 | -20 | -37 |
| 2006 | -66 | -66 | -21 | -27 | -7 | -24 | -27 | -33 | -39 | -81 | -74 | -80 |
| 2007 | -87 | -62 | -38 | -16 | -31 | -7 | -51 | -43 | -58 | -87 | -88 | -74 |
| 2008 | -80 | -74 | -52 | -38 | -70 | -65 | -54 | -44 | -65 | -78 | -64 | -65 |
| 2009 | -67 | -78 | -87 | -45 | -19 | -34 | -53 | -69 | -63 | -99 | -83 | -81 |
| 2010 | -96 | -88 | -75 | -32 | -55 | -45 | -48 | -57 | -105 | -139 | -132 | -132 |
| 2011 | -140 | -148 | -125 | -101 | -123 | -123 | -115 | -112 | -118 | -129 | -128 | -151 |
| 2012 | -139 | -151 | -149 | -101 | -141 | -150 | -165 | -154 | -182 | -141 | -176 | -200 |
| 2013 | -172 | -146 | -163 | -111 | -170 | -160 | -162 | -159 | -172 | -187 | -204 | -190 |
| 2014 | -206 | -207 | -160 | -199 | -235 | -230 | -203 | -239 | -283 | -293 | -299 | -305 |
| 2015 | -279 | -262 | -257 | -251 | -248 | -251 | -214 | -246 | -269 | -250 | -283 | -292 |
| 2016 | -290 | -279 | -260 | -257 | -270 | -257 | -275 | -275 | -257 | -276 | -270 | -267 |
| 2017 | -274 | -253 | -198 | -254 | -274 | -280 | -267 | -262 | -255 | -258 | -231 | -291 |
| 2018 | -275 | -201 | -208 | -272 | -291 | -292 | -305 | -284 | -285 | -305 | -295 | -312 |
| 2019 | -300 | -327 | -270 | -296 | -297 | -296 | -279 | -301 | -300 | -315 | -334 | -340 |
| 2020 | -246 | -234 | -255 | -203 | -226 | -266 | -282 | -274 | -286 | -288 | -303 | -251 |
| 2021 | -292 | -219 | -226 | -290 | -283 | -243 | -272 | -295 | -291 | -313 | -305 | -304 |
| 2022 | -307 | -294 | -238 | -273 | -259 | -298 | -264 | -274 | -298 | -277 | -315 | -291 |
| 2023 | -287 | -282 | -282 | -268 | -245 | -221 | -279 | -250 | -247 | -211 | -237 | -293 |
| 2024 | -271 | -252 | ||||||||||
| - = No Data Reported; -- = Not Applicable; NA = Not Available; W = Withheld to avoid disclosure of individual company data. |
| Release Date: 4/30/2024 |
| Next Release Date: 5/31/2024 |
Referring Pages: