|
Download Data (XLS File) |
|
||||||||
|
||||||||
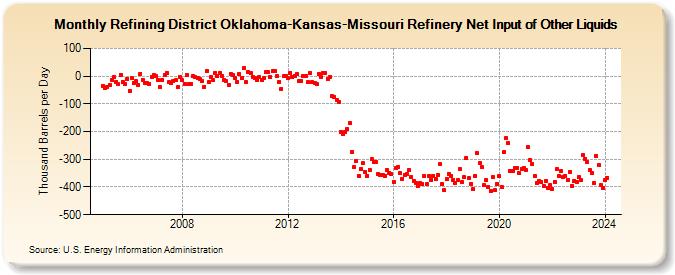
| Refining District Oklahoma-Kansas-Missouri Refinery Net Input of Other Liquids (Thousand Barrels per Day) | ||||||||
| Year | Jan | Feb | Mar | Apr | May | Jun | Jul | Aug | Sep | Oct | Nov | Dec |
|---|---|---|---|---|---|---|---|---|---|---|---|---|
| 2005 | -34 | -44 | -38 | -31 | -13 | -5 | -20 | -30 | 5 | -20 | -30 | -10 |
| 2006 | -52 | -7 | -25 | -19 | -32 | 9 | -14 | -26 | -25 | -27 | -2 | 5 |
| 2007 | -1 | -14 | -39 | -14 | 5 | 13 | -22 | -24 | -16 | -15 | -41 | -3 |
| 2008 | -15 | -28 | 5 | -29 | -27 | 0 | -4 | -8 | -11 | -19 | -38 | 19 |
| 2009 | -23 | -2 | -15 | 12 | 2 | 12 | 0 | -14 | -19 | -32 | 8 | 3 |
| 2010 | -6 | -21 | 6 | -8 | 30 | -22 | 14 | 13 | -2 | -6 | -13 | -5 |
| 2011 | -14 | -7 | 14 | 14 | -5 | 18 | 19 | 0 | -20 | -45 | -1 | 2 |
| 2012 | -8 | 13 | -5 | 1 | 7 | -16 | -18 | 1 | 0 | -22 | 12 | -23 |
| 2013 | -25 | -30 | 9 | -3 | 13 | 12 | -10 | -2 | -73 | -76 | -85 | -92 |
| 2014 | -200 | -208 | -203 | -190 | -169 | -274 | -329 | -305 | -359 | -334 | -315 | -345 |
| 2015 | -360 | -338 | -300 | -309 | -309 | -352 | -355 | -355 | -359 | -338 | -349 | -353 |
| 2016 | -381 | -333 | -327 | -350 | -370 | -356 | -354 | -339 | -364 | -377 | -385 | -398 |
| 2017 | -387 | -391 | -361 | -391 | -359 | -374 | -359 | -372 | -355 | -318 | -390 | -412 |
| 2018 | -372 | -352 | -360 | -373 | -384 | -375 | -336 | -382 | -365 | -294 | -369 | -388 |
| 2019 | -408 | -359 | -279 | -315 | -328 | -394 | -375 | -400 | -414 | -365 | -412 | -388 |
| 2020 | -362 | -400 | -275 | -224 | -241 | -343 | -341 | -331 | -330 | -351 | -334 | -331 |
| 2021 | -339 | -257 | -303 | -318 | -361 | -386 | -378 | -383 | -396 | -379 | -405 | -392 |
| 2022 | -406 | -381 | -336 | -359 | -344 | -363 | -361 | -374 | -345 | -395 | -377 | -381 |
| 2023 | -365 | -376 | -286 | -299 | -309 | -338 | -348 | -385 | -288 | -322 | -394 | -403 |
| 2024 | -375 | -366 | ||||||||||
| - = No Data Reported; -- = Not Applicable; NA = Not Available; W = Withheld to avoid disclosure of individual company data. |
| Release Date: 4/30/2024 |
| Next Release Date: 5/31/2024 |