|
Download Data (XLS File) |
|
||||||||
|
||||||||
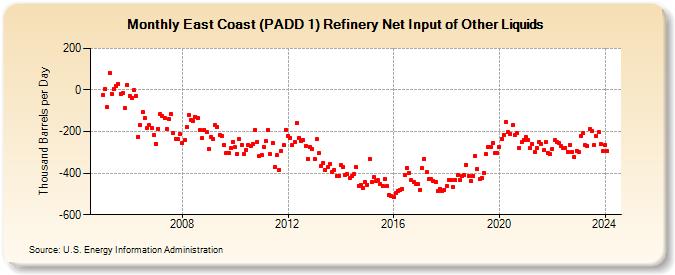
| East Coast (PADD 1) Refinery Net Input of Other Liquids (Thousand Barrels per Day) | ||||||||
| Year | Jan | Feb | Mar | Apr | May | Jun | Jul | Aug | Sep | Oct | Nov | Dec |
|---|---|---|---|---|---|---|---|---|---|---|---|---|
| 2005 | -24 | 4 | -82 | 83 | -19 | 5 | 17 | 30 | -17 | -16 | -89 | 25 |
| 2006 | -29 | -37 | -2 | -28 | -224 | -169 | -107 | -134 | -182 | -170 | -183 | -217 |
| 2007 | -258 | -186 | -116 | -123 | -135 | -188 | -142 | -116 | -207 | -235 | -236 | -213 |
| 2008 | -256 | -241 | -177 | -118 | -143 | -151 | -130 | -136 | -192 | -232 | -191 | -204 |
| 2009 | -284 | -224 | -236 | -170 | -177 | -216 | -221 | -264 | -301 | -301 | -280 | -249 |
| 2010 | -276 | -306 | -236 | -263 | -309 | -287 | -264 | -269 | -259 | -191 | -249 | -319 |
| 2011 | -311 | -272 | -245 | -194 | -310 | -253 | -371 | -315 | -383 | -294 | -267 | -191 |
| 2012 | -219 | -229 | -264 | -248 | -159 | -230 | -247 | -243 | -269 | -333 | -274 | -285 |
| 2013 | -332 | -238 | -303 | -368 | -350 | -386 | -372 | -357 | -393 | -384 | -416 | -413 |
| 2014 | -363 | -369 | -410 | -405 | -424 | -415 | -404 | -372 | -460 | -455 | -471 | -444 |
| 2015 | -455 | -333 | -445 | -421 | -440 | -435 | -452 | -462 | -426 | -464 | -503 | -510 |
| 2016 | -517 | -497 | -484 | -481 | -474 | -410 | -373 | -397 | -435 | -444 | -454 | -454 |
| 2017 | -479 | -376 | -333 | -395 | -429 | -429 | -440 | -444 | -487 | -476 | -486 | -481 |
| 2018 | -461 | -431 | -433 | -467 | -432 | -410 | -434 | -413 | -409 | -359 | -413 | -438 |
| 2019 | -412 | -318 | -382 | -430 | -423 | -400 | -309 | -273 | -272 | -255 | -302 | -305 |
| 2020 | -272 | -237 | -216 | -154 | -204 | -212 | -170 | -218 | -208 | -279 | -252 | -240 |
| 2021 | -227 | -241 | -279 | -261 | -300 | -280 | -251 | -261 | -291 | -250 | -302 | -308 |
| 2022 | -282 | -240 | -250 | -255 | -269 | -278 | -277 | -298 | -263 | -297 | -323 | -292 |
| 2023 | -300 | -219 | -209 | -267 | -269 | -188 | -196 | -265 | -222 | -204 | -261 | -295 |
| 2024 | -264 | -294 | ||||||||||
| - = No Data Reported; -- = Not Applicable; NA = Not Available; W = Withheld to avoid disclosure of individual company data. |
| Release Date: 4/30/2024 |
| Next Release Date: 5/31/2024 |
Referring Pages: