|
Download Data (XLS File) |
|
||||||||
|
||||||||
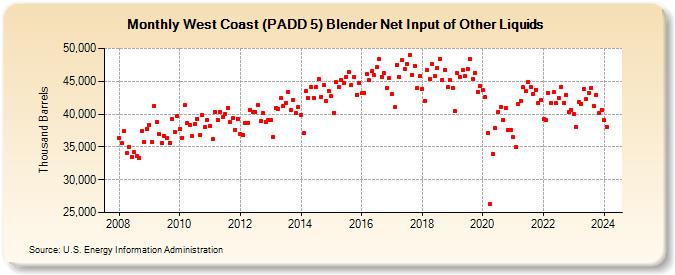
| West Coast (PADD 5) Blender Net Input of Other Liquids (Thousand Barrels) | ||||||||
| Year | Jan | Feb | Mar | Apr | May | Jun | Jul | Aug | Sep | Oct | Nov | Dec |
|---|---|---|---|---|---|---|---|---|---|---|---|---|
| 2008 | 36,351 | 35,530 | 37,380 | 34,068 | 35,052 | 33,453 | 34,246 | 33,654 | 33,340 | 37,464 | 35,736 | 37,791 |
| 2009 | 38,349 | 35,812 | 41,274 | 38,794 | 36,947 | 35,622 | 36,716 | 36,391 | 35,649 | 39,270 | 37,200 | 39,657 |
| 2010 | 37,775 | 36,397 | 41,329 | 38,608 | 38,389 | 36,588 | 38,544 | 39,283 | 36,783 | 39,884 | 38,065 | 39,165 |
| 2011 | 38,222 | 36,164 | 40,339 | 39,142 | 40,323 | 39,491 | 40,020 | 40,956 | 38,765 | 39,348 | 37,615 | 39,278 |
| 2012 | 37,028 | 36,736 | 38,676 | 38,692 | 40,654 | 40,262 | 40,319 | 41,408 | 38,936 | 40,151 | 38,861 | 39,047 |
| 2013 | 39,062 | 36,502 | 40,965 | 40,742 | 42,440 | 41,219 | 41,752 | 43,361 | 40,625 | 42,154 | 40,165 | 41,102 |
| 2014 | 39,926 | 37,054 | 43,441 | 42,408 | 44,158 | 42,490 | 44,143 | 45,340 | 42,636 | 44,461 | 41,977 | 43,519 |
| 2015 | 42,703 | 40,213 | 44,892 | 44,078 | 45,115 | 44,697 | 45,625 | 46,418 | 44,435 | 45,677 | 42,978 | 44,754 |
| 2016 | 43,137 | 43,244 | 46,082 | 45,137 | 46,484 | 45,908 | 47,151 | 48,397 | 45,606 | 46,178 | 44,004 | 45,431 |
| 2017 | 42,985 | 41,006 | 47,510 | 45,698 | 48,231 | 46,849 | 47,615 | 49,006 | 45,956 | 47,350 | 43,928 | 45,756 |
| 2018 | 43,871 | 41,996 | 46,710 | 45,349 | 47,585 | 45,778 | 47,077 | 48,454 | 45,251 | 46,716 | 44,058 | 45,119 |
| 2019 | 43,971 | 40,435 | 46,234 | 45,581 | 46,647 | 45,735 | 46,929 | 48,409 | 45,388 | 46,303 | 43,410 | 44,297 |
| 2020 | 43,630 | 42,573 | 37,114 | 26,246 | 33,918 | 37,826 | 40,250 | 41,106 | 39,133 | 40,888 | 37,569 | 37,610 |
| 2021 | 36,458 | 35,001 | 41,607 | 41,942 | 44,075 | 43,466 | 44,909 | 44,123 | 43,093 | 43,727 | 41,700 | 42,100 |
| 2022 | 39,250 | 39,133 | 43,241 | 41,698 | 43,291 | 41,635 | 42,517 | 44,138 | 41,678 | 42,910 | 40,381 | 40,679 |
| 2023 | 39,988 | 37,970 | 41,894 | 41,590 | 43,817 | 42,312 | 43,260 | 44,020 | 41,294 | 42,871 | 40,166 | 40,687 |
| 2024 | 39,051 | |||||||||||
| - = No Data Reported; -- = Not Applicable; NA = Not Available; W = Withheld to avoid disclosure of individual company data. |
| Release Date: 3/29/2024 |
| Next Release Date: 4/30/2024 |
Referring Pages: