|
Download Data (XLS File) |
|
||||||||
|
||||||||
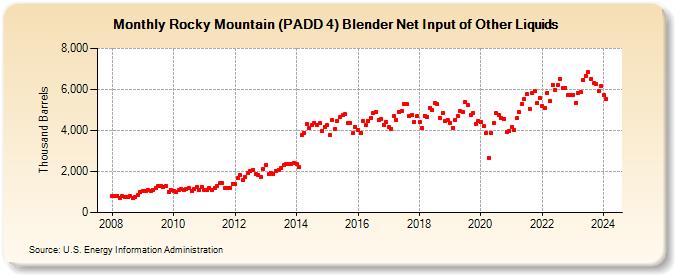
| Rocky Mountain (PADD 4) Blender Net Input of Other Liquids (Thousand Barrels) | ||||||||
| Year | Jan | Feb | Mar | Apr | May | Jun | Jul | Aug | Sep | Oct | Nov | Dec |
|---|---|---|---|---|---|---|---|---|---|---|---|---|
| 2008 | 794 | 794 | 801 | 709 | 791 | 738 | 775 | 803 | 686 | 746 | 875 | 996 |
| 2009 | 1,039 | 1,066 | 1,100 | 1,059 | 1,092 | 1,199 | 1,275 | 1,282 | 1,262 | 1,283 | 1,023 | 1,115 |
| 2010 | 1,068 | 992 | 1,115 | 1,153 | 1,118 | 1,166 | 1,179 | 1,062 | 1,150 | 1,257 | 1,110 | 1,247 |
| 2011 | 1,084 | 1,081 | 1,206 | 1,119 | 1,203 | 1,285 | 1,424 | 1,429 | 1,199 | 1,212 | 1,220 | 1,405 |
| 2012 | 1,380 | 1,662 | 1,824 | 1,581 | 1,747 | 1,945 | 2,046 | 2,084 | 1,859 | 1,824 | 1,753 | 2,128 |
| 2013 | 2,331 | 1,861 | 1,937 | 1,874 | 2,030 | 2,089 | 2,193 | 2,295 | 2,348 | 2,376 | 2,381 | 2,416 |
| 2014 | 2,375 | 2,218 | 3,776 | 3,878 | 4,296 | 4,142 | 4,255 | 4,380 | 4,255 | 4,341 | 3,991 | 4,165 |
| 2015 | 4,249 | 3,778 | 4,495 | 4,092 | 4,484 | 4,651 | 4,778 | 4,790 | 4,343 | 4,369 | 3,864 | 4,177 |
| 2016 | 4,027 | 3,865 | 4,470 | 4,271 | 4,479 | 4,615 | 4,850 | 4,880 | 4,502 | 4,578 | 4,265 | 4,415 |
| 2017 | 4,145 | 4,090 | 4,710 | 4,514 | 4,918 | 4,954 | 5,307 | 5,279 | 4,684 | 4,766 | 4,434 | 4,693 |
| 2018 | 4,407 | 4,100 | 4,721 | 4,666 | 5,113 | 5,005 | 5,354 | 5,268 | 4,622 | 4,854 | 4,441 | 4,515 |
| 2019 | 4,372 | 4,125 | 4,514 | 4,691 | 4,934 | 4,911 | 5,364 | 5,238 | 4,745 | 4,858 | 4,325 | 4,479 |
| 2020 | 4,394 | 4,195 | 3,880 | 2,670 | 3,884 | 4,366 | 4,835 | 4,775 | 4,611 | 4,571 | 3,928 | 3,954 |
| 2021 | 4,149 | 4,031 | 4,588 | 4,879 | 5,311 | 5,531 | 5,764 | 5,070 | 5,814 | 5,918 | 5,355 | 5,575 |
| 2022 | 5,196 | 5,087 | 5,849 | 5,416 | 6,218 | 5,986 | 6,233 | 6,508 | 6,087 | 6,086 | 5,720 | 5,732 |
| 2023 | 5,741 | 5,336 | 5,837 | 5,878 | 6,482 | 6,655 | 6,837 | 6,527 | 6,301 | 6,270 | 5,918 | 6,161 |
| 2024 | 5,710 | |||||||||||
| - = No Data Reported; -- = Not Applicable; NA = Not Available; W = Withheld to avoid disclosure of individual company data. |
| Release Date: 3/29/2024 |
| Next Release Date: 4/30/2024 |
Referring Pages: