|
Download Data (XLS File) |
|
||||||||
|
||||||||
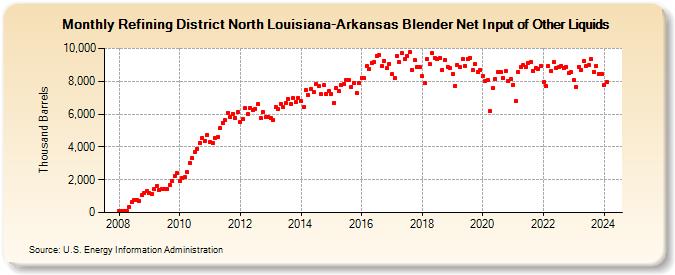
| Refining District North Louisiana-Arkansas Blender Net Input of Other Liquids (Thousand Barrels) | ||||||||
| Year | Jan | Feb | Mar | Apr | May | Jun | Jul | Aug | Sep | Oct | Nov | Dec |
|---|---|---|---|---|---|---|---|---|---|---|---|---|
| 2008 | 105 | 96 | 111 | 114 | 351 | 642 | 735 | 753 | 696 | 1,051 | 1,202 | 1,296 |
| 2009 | 1,164 | 1,147 | 1,443 | 1,619 | 1,395 | 1,451 | 1,407 | 1,431 | 1,684 | 1,894 | 2,223 | 2,390 |
| 2010 | 1,936 | 2,094 | 2,159 | 2,468 | 3,019 | 3,321 | 3,681 | 3,892 | 4,235 | 4,547 | 4,373 | 4,727 |
| 2011 | 4,322 | 4,223 | 4,568 | 4,591 | 5,144 | 5,482 | 5,638 | 6,085 | 5,796 | 6,019 | 5,771 | 6,122 |
| 2012 | 5,534 | 5,695 | 6,359 | 5,975 | 6,371 | 6,222 | 6,334 | 6,616 | 5,774 | 6,120 | 5,801 | 5,826 |
| 2013 | 5,731 | 5,612 | 6,412 | 6,287 | 6,633 | 6,403 | 6,686 | 6,895 | 6,634 | 6,975 | 6,716 | 6,969 |
| 2014 | 6,776 | 6,416 | 7,441 | 7,143 | 7,552 | 7,366 | 7,816 | 7,717 | 7,198 | 7,743 | 7,214 | 7,398 |
| 2015 | 7,219 | 6,699 | 7,568 | 7,418 | 7,765 | 7,818 | 8,105 | 8,075 | 7,654 | 7,910 | 7,290 | 7,890 |
| 2016 | 8,212 | 8,166 | 8,912 | 8,730 | 9,138 | 9,176 | 9,552 | 9,570 | 8,912 | 9,257 | 8,801 | 9,056 |
| 2017 | 8,416 | 8,167 | 9,563 | 9,167 | 9,695 | 9,342 | 9,550 | 9,753 | 8,705 | 9,264 | 8,842 | 8,881 |
| 2018 | 8,298 | 7,878 | 9,331 | 9,027 | 9,690 | 9,406 | 9,357 | 9,437 | 8,688 | 9,310 | 8,891 | 8,788 |
| 2019 | 8,426 | 7,725 | 8,983 | 8,851 | 9,360 | 8,943 | 9,341 | 9,438 | 8,682 | 9,057 | 8,559 | 8,687 |
| 2020 | 8,292 | 8,020 | 8,051 | 6,159 | 7,579 | 8,132 | 8,565 | 8,542 | 8,213 | 8,600 | 7,989 | 8,121 |
| 2021 | 7,782 | 6,784 | 8,566 | 8,853 | 8,984 | 8,882 | 9,139 | 9,196 | 8,646 | 8,834 | 8,757 | 8,903 |
| 2022 | 7,926 | 7,701 | 8,942 | 8,609 | 9,164 | 8,776 | 8,857 | 8,942 | 8,778 | 8,857 | 8,499 | 8,532 |
| 2023 | 8,049 | 7,657 | 8,882 | 8,679 | 9,246 | 8,938 | 9,000 | 9,296 | 8,577 | 8,934 | 8,454 | 8,427 |
| 2024 | 7,743 | 7,962 | 8,604 | 8,619 | 9,035 | 8,557 | ||||||
| - = No Data Reported; -- = Not Applicable; NA = Not Available; W = Withheld to avoid disclosure of individual company data. |
| Release Date: 8/30/2024 |
| Next Release Date: 9/30/2024 |