|
Download Data (XLS File) |
|
||||||||
|
||||||||
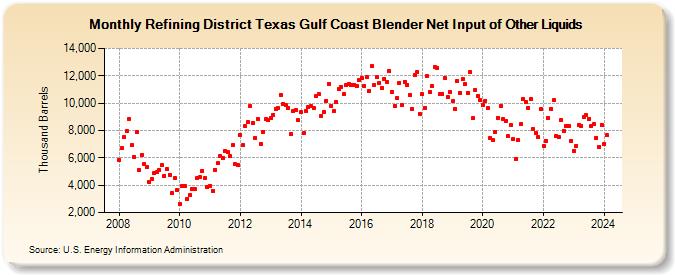
| Refining District Texas Gulf Coast Blender Net Input of Other Liquids (Thousand Barrels) | ||||||||
| Year | Jan | Feb | Mar | Apr | May | Jun | Jul | Aug | Sep | Oct | Nov | Dec |
|---|---|---|---|---|---|---|---|---|---|---|---|---|
| 2008 | 5,856 | 6,695 | 7,538 | 7,965 | 8,848 | 6,922 | 6,086 | 7,886 | 5,128 | 6,222 | 5,560 | 5,308 |
| 2009 | 4,202 | 4,431 | 4,856 | 4,936 | 5,132 | 5,474 | 4,707 | 5,164 | 4,774 | 3,424 | 4,515 | 3,620 |
| 2010 | 2,639 | 3,916 | 3,957 | 3,026 | 3,278 | 3,727 | 3,709 | 4,496 | 4,593 | 5,041 | 4,529 | 3,859 |
| 2011 | 3,970 | 3,603 | 5,141 | 5,602 | 6,116 | 5,966 | 6,494 | 6,415 | 6,105 | 6,912 | 5,519 | 5,463 |
| 2012 | 7,703 | 6,932 | 8,318 | 8,619 | 9,759 | 8,570 | 7,471 | 8,824 | 7,018 | 7,912 | 8,820 | 8,802 |
| 2013 | 8,939 | 9,167 | 9,559 | 9,647 | 10,625 | 9,951 | 9,863 | 9,645 | 7,727 | 9,396 | 9,498 | 8,738 |
| 2014 | 9,316 | 7,812 | 9,458 | 9,687 | 9,771 | 9,622 | 10,485 | 10,641 | 9,042 | 9,362 | 10,185 | 11,421 |
| 2015 | 9,818 | 9,420 | 10,099 | 10,999 | 11,213 | 10,630 | 11,321 | 11,395 | 11,320 | 11,349 | 11,228 | 11,654 |
| 2016 | 11,857 | 11,281 | 11,922 | 10,908 | 12,694 | 11,315 | 11,893 | 11,498 | 11,137 | 11,785 | 11,569 | 12,348 |
| 2017 | 10,840 | 9,791 | 10,379 | 11,472 | 9,838 | 11,567 | 11,355 | 10,602 | 9,600 | 12,036 | 12,274 | 9,199 |
| 2018 | 10,641 | 9,652 | 11,946 | 10,802 | 11,216 | 12,630 | 12,589 | 10,650 | 10,698 | 11,817 | 10,458 | 10,807 |
| 2019 | 10,128 | 9,587 | 11,612 | 10,763 | 11,732 | 11,372 | 10,759 | 12,279 | 8,905 | 10,955 | 10,532 | 10,224 |
| 2020 | 9,826 | 10,191 | 9,609 | 7,458 | 7,282 | 7,907 | 8,942 | 9,779 | 8,814 | 8,690 | 7,561 | 8,365 |
| 2021 | 7,341 | 5,892 | 7,312 | 8,452 | 10,291 | 10,087 | 9,663 | 10,268 | 8,089 | 7,810 | 7,493 | 9,539 |
| 2022 | 6,893 | 7,264 | 8,906 | 9,581 | 10,213 | 7,589 | 7,546 | 8,756 | 7,963 | 8,315 | 8,341 | 7,260 |
| 2023 | 6,536 | 6,874 | 8,394 | 8,362 | 8,970 | 9,115 | 8,866 | 8,355 | 8,462 | 7,471 | 6,824 | 8,404 |
| 2024 | 7,011 | |||||||||||
| - = No Data Reported; -- = Not Applicable; NA = Not Available; W = Withheld to avoid disclosure of individual company data. |
| Release Date: 3/29/2024 |
| Next Release Date: 4/30/2024 |
Referring Pages: