|
Download Data (XLS File) |
|
||||||||
|
||||||||
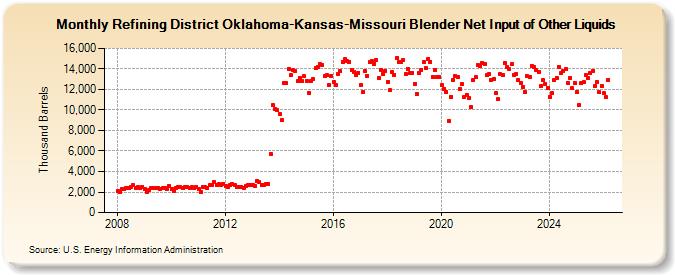
| Refining District Oklahoma-Kansas-Missouri Blender Net Input of Other Liquids (Thousand Barrels) | ||||||||
| Year | Jan | Feb | Mar | Apr | May | Jun | Jul | Aug | Sep | Oct | Nov | Dec |
|---|---|---|---|---|---|---|---|---|---|---|---|---|
| 2008 | 2,118 | 1,982 | 2,278 | 2,278 | 2,401 | 2,371 | 2,530 | 2,650 | 2,378 | 2,449 | 2,410 | 2,530 |
| 2009 | 2,304 | 2,030 | 2,243 | 2,354 | 2,403 | 2,366 | 2,398 | 2,315 | 2,352 | 2,434 | 2,344 | 2,582 |
| 2010 | 2,293 | 2,130 | 2,419 | 2,486 | 2,489 | 2,420 | 2,474 | 2,484 | 2,389 | 2,444 | 2,431 | 2,498 |
| 2011 | 2,267 | 2,013 | 2,487 | 2,466 | 2,419 | 2,654 | 2,687 | 2,933 | 2,665 | 2,765 | 2,727 | 2,814 |
| 2012 | 2,617 | 2,444 | 2,718 | 2,762 | 2,716 | 2,530 | 2,483 | 2,505 | 2,378 | 2,565 | 2,723 | 2,697 |
| 2013 | 2,641 | 2,602 | 3,063 | 2,989 | 2,641 | 2,733 | 2,790 | 2,820 | 5,722 | 10,436 | 10,087 | 9,962 |
| 2014 | 9,623 | 8,977 | 12,614 | 12,612 | 14,030 | 13,377 | 13,846 | 13,795 | 12,800 | 13,161 | 12,818 | 13,278 |
| 2015 | 12,824 | 11,678 | 12,864 | 12,992 | 14,046 | 14,225 | 14,439 | 14,386 | 13,322 | 13,378 | 12,391 | 13,341 |
| 2016 | 12,742 | 12,477 | 13,542 | 13,786 | 14,721 | 14,930 | 14,781 | 14,704 | 13,876 | 13,747 | 13,387 | 13,641 |
| 2017 | 12,401 | 11,735 | 13,767 | 13,319 | 14,638 | 14,737 | 14,508 | 14,845 | 13,153 | 13,920 | 13,492 | 13,839 |
| 2018 | 12,769 | 11,904 | 13,693 | 13,438 | 15,059 | 14,685 | 14,657 | 14,864 | 13,503 | 14,004 | 13,593 | 13,604 |
| 2019 | 12,576 | 11,577 | 13,627 | 13,920 | 14,630 | 14,078 | 14,986 | 14,685 | 13,222 | 13,933 | 13,204 | 13,205 |
| 2020 | 12,412 | 12,078 | 11,797 | 8,926 | 11,307 | 12,925 | 13,343 | 13,233 | 12,083 | 12,549 | 11,274 | 11,459 |
| 2021 | 11,206 | 10,263 | 12,907 | 13,172 | 14,384 | 14,316 | 14,617 | 14,482 | 13,381 | 13,486 | 12,952 | 13,006 |
| 2022 | 11,699 | 11,023 | 13,491 | 13,388 | 14,577 | 14,200 | 13,967 | 14,432 | 13,453 | 13,511 | 12,917 | 12,657 |
| 2023 | 12,243 | 11,742 | 13,329 | 13,249 | 14,326 | 14,181 | 13,890 | 13,678 | 12,287 | 12,871 | 12,537 | 12,130 |
| 2024 | 11,302 | 11,695 | 12,922 | 13,149 | 14,214 | 13,583 | ||||||
| - = No Data Reported; -- = Not Applicable; NA = Not Available; W = Withheld to avoid disclosure of individual company data. |
| Release Date: 8/30/2024 |
| Next Release Date: 9/30/2024 |