|
Download Data (XLS File) |
|
||||||||
|
||||||||
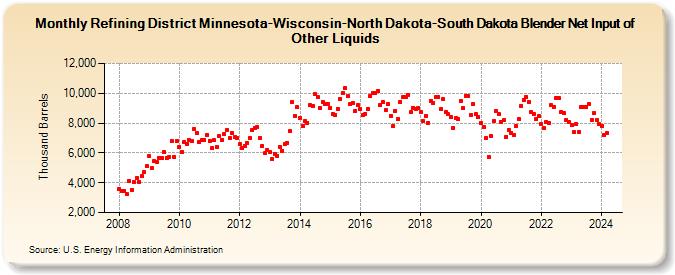
| Refining District Minnesota-Wisconsin-North Dakota-South Dakota Blender Net Input of Other Liquids (Thousand Barrels) | ||||||||
| Year | Jan | Feb | Mar | Apr | May | Jun | Jul | Aug | Sep | Oct | Nov | Dec |
|---|---|---|---|---|---|---|---|---|---|---|---|---|
| 2008 | 3,613 | 3,477 | 3,469 | 3,234 | 4,130 | 3,543 | 4,061 | 4,329 | 4,053 | 4,422 | 4,725 | 5,121 |
| 2009 | 5,763 | 4,976 | 5,441 | 5,412 | 5,670 | 5,650 | 6,075 | 5,674 | 5,746 | 6,813 | 5,719 | 6,793 |
| 2010 | 6,419 | 6,055 | 6,732 | 6,590 | 6,857 | 6,780 | 7,610 | 7,348 | 6,729 | 6,848 | 6,854 | 7,224 |
| 2011 | 6,798 | 6,325 | 6,836 | 6,425 | 7,142 | 6,891 | 7,278 | 7,533 | 6,994 | 7,334 | 7,064 | 7,006 |
| 2012 | 6,576 | 6,336 | 6,495 | 6,668 | 7,007 | 7,519 | 7,676 | 7,721 | 7,034 | 6,453 | 5,971 | 6,179 |
| 2013 | 6,064 | 5,569 | 5,959 | 5,822 | 6,406 | 6,158 | 6,584 | 6,694 | 7,459 | 9,387 | 8,487 | 9,050 |
| 2014 | 8,349 | 7,789 | 8,156 | 8,037 | 9,193 | 9,119 | 9,950 | 9,781 | 9,006 | 9,420 | 9,264 | 9,255 |
| 2015 | 9,038 | 8,625 | 8,566 | 8,954 | 9,640 | 9,993 | 10,352 | 9,812 | 9,277 | 9,351 | 8,842 | 9,204 |
| 2016 | 8,945 | 8,555 | 8,636 | 8,921 | 9,786 | 10,011 | 10,003 | 10,186 | 9,210 | 9,402 | 8,879 | 9,286 |
| 2017 | 8,492 | 7,795 | 8,834 | 8,277 | 9,449 | 9,751 | 9,775 | 9,894 | 8,722 | 9,028 | 8,941 | 8,995 |
| 2018 | 8,718 | 8,139 | 8,502 | 8,027 | 9,492 | 9,364 | 9,730 | 9,781 | 8,947 | 9,614 | 8,761 | 8,590 |
| 2019 | 8,395 | 7,669 | 8,370 | 8,264 | 9,485 | 9,015 | 9,839 | 9,813 | 8,534 | 9,269 | 8,584 | 8,426 |
| 2020 | 8,018 | 7,742 | 7,013 | 5,760 | 7,132 | 8,140 | 8,787 | 8,631 | 8,108 | 8,192 | 7,090 | 7,535 |
| 2021 | 7,355 | 7,211 | 7,815 | 8,265 | 9,177 | 9,554 | 9,783 | 9,442 | 8,728 | 8,594 | 8,308 | 8,454 |
| 2022 | 7,971 | 7,680 | 8,103 | 7,975 | 9,198 | 9,104 | 9,665 | 9,670 | 8,757 | 8,647 | 8,240 | 8,108 |
| 2023 | 7,849 | 7,386 | 7,927 | 7,415 | 9,091 | 9,095 | 9,088 | 9,308 | 8,204 | 8,675 | 8,209 | 7,972 |
| 2024 | 7,793 | 7,216 | ||||||||||
| - = No Data Reported; -- = Not Applicable; NA = Not Available; W = Withheld to avoid disclosure of individual company data. |
| Release Date: 4/30/2024 |
| Next Release Date: 5/31/2024 |