|
Download Data (XLS File) |
|
||||||||
|
||||||||
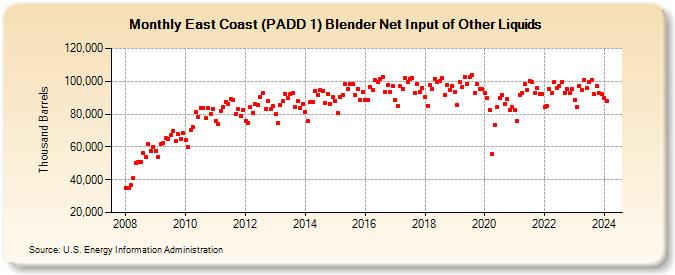
| East Coast (PADD 1) Blender Net Input of Other Liquids (Thousand Barrels) | ||||||||
| Year | Jan | Feb | Mar | Apr | May | Jun | Jul | Aug | Sep | Oct | Nov | Dec |
|---|---|---|---|---|---|---|---|---|---|---|---|---|
| 2008 | 34,809 | 34,996 | 36,820 | 41,064 | 49,985 | 50,556 | 50,954 | 56,002 | 53,568 | 61,681 | 57,652 | 59,972 |
| 2009 | 57,784 | 53,970 | 61,787 | 62,152 | 65,559 | 65,108 | 66,965 | 69,563 | 63,490 | 67,608 | 65,092 | 68,557 |
| 2010 | 64,281 | 60,226 | 70,172 | 72,205 | 81,154 | 77,963 | 83,681 | 83,432 | 77,479 | 83,446 | 79,881 | 83,355 |
| 2011 | 76,004 | 73,667 | 81,834 | 84,519 | 87,617 | 86,081 | 89,163 | 88,645 | 80,003 | 82,820 | 78,776 | 82,574 |
| 2012 | 75,755 | 74,549 | 84,224 | 80,872 | 86,160 | 85,335 | 90,256 | 92,542 | 82,939 | 88,066 | 82,999 | 84,627 |
| 2013 | 79,770 | 74,702 | 85,275 | 87,802 | 92,309 | 89,768 | 92,256 | 92,561 | 84,439 | 88,089 | 83,755 | 86,001 |
| 2014 | 81,479 | 75,764 | 87,479 | 87,444 | 94,292 | 91,859 | 94,363 | 93,916 | 86,960 | 92,228 | 85,890 | 90,142 |
| 2015 | 87,967 | 80,719 | 90,590 | 91,487 | 98,048 | 95,106 | 98,399 | 98,555 | 91,356 | 95,338 | 88,475 | 93,184 |
| 2016 | 88,780 | 88,436 | 96,470 | 94,859 | 100,721 | 99,655 | 101,365 | 102,564 | 93,702 | 97,664 | 93,404 | 96,987 |
| 2017 | 88,656 | 84,614 | 97,012 | 95,390 | 101,848 | 99,611 | 101,084 | 102,127 | 92,709 | 98,275 | 93,707 | 95,925 |
| 2018 | 90,383 | 85,106 | 97,677 | 95,162 | 101,520 | 99,401 | 99,991 | 101,704 | 91,634 | 97,694 | 94,727 | 96,835 |
| 2019 | 93,191 | 85,412 | 99,251 | 96,744 | 102,736 | 98,592 | 102,678 | 103,981 | 92,937 | 98,232 | 95,138 | 95,386 |
| 2020 | 92,705 | 89,546 | 82,624 | 55,586 | 73,174 | 84,137 | 89,889 | 91,724 | 85,913 | 89,431 | 82,365 | 84,022 |
| 2021 | 82,323 | 75,681 | 91,570 | 92,711 | 98,149 | 94,867 | 99,962 | 99,690 | 92,889 | 95,939 | 92,312 | 92,413 |
| 2022 | 84,125 | 85,006 | 95,308 | 92,706 | 99,417 | 96,115 | 96,868 | 99,740 | 92,930 | 95,452 | 92,575 | 95,170 |
| 2023 | 88,857 | 84,543 | 97,207 | 94,679 | 100,586 | 95,648 | 99,306 | 100,942 | 92,011 | 96,828 | 92,878 | 92,048 |
| 2024 | 89,886 | |||||||||||
| - = No Data Reported; -- = Not Applicable; NA = Not Available; W = Withheld to avoid disclosure of individual company data. |
| Release Date: 3/29/2024 |
| Next Release Date: 4/30/2024 |
Referring Pages: