|
Download Data (XLS File) |
|
||||||||
|
||||||||
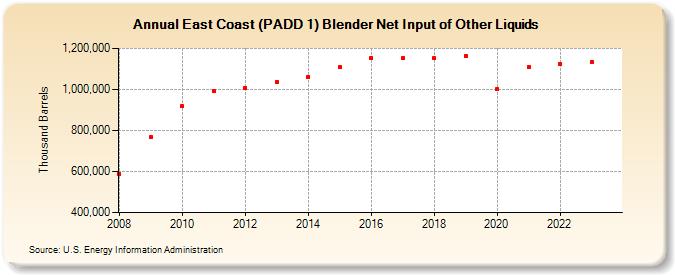
| East Coast (PADD 1) Blender Net Input of Other Liquids (Thousand Barrels) | ||||||||
| Decade | Year-0 | Year-1 | Year-2 | Year-3 | Year-4 | Year-5 | Year-6 | Year-7 | Year-8 | Year-9 |
|---|---|---|---|---|---|---|---|---|---|---|
| 2000's | 588,059 | 767,635 | ||||||||
| 2010's | 917,275 | 991,703 | 1,008,324 | 1,036,727 | 1,061,816 | 1,109,224 | 1,154,607 | 1,150,958 | 1,151,834 | 1,164,278 |
| 2020's | 1,001,116 | 1,108,506 | 1,125,412 | 1,135,533 |
| - = No Data Reported; -- = Not Applicable; NA = Not Available; W = Withheld to avoid disclosure of individual company data. |
| Release Date: 3/29/2024 |
| Next Release Date: 8/30/2024 |
Referring Pages: