|
Download Data (XLS File) |
|
||||||||
|
||||||||
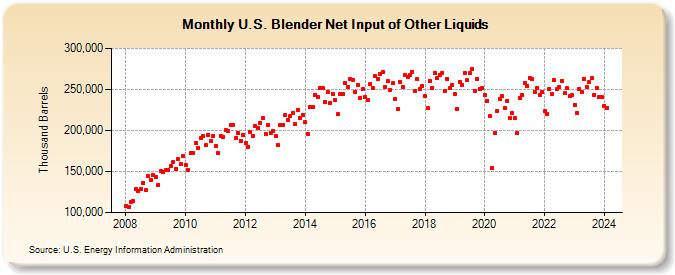
| U.S. Blender Net Input of Other Liquids (Thousand Barrels) | ||||||||
| Year | Jan | Feb | Mar | Apr | May | Jun | Jul | Aug | Sep | Oct | Nov | Dec |
|---|---|---|---|---|---|---|---|---|---|---|---|---|
| 2008 | 107,894 | 107,134 | 113,282 | 113,887 | 128,875 | 125,842 | 128,947 | 136,074 | 127,501 | 144,597 | 139,067 | 145,648 |
| 2009 | 142,849 | 133,482 | 150,428 | 148,945 | 151,724 | 151,795 | 156,570 | 161,614 | 153,091 | 165,550 | 159,234 | 169,236 |
| 2010 | 158,384 | 151,818 | 173,055 | 172,204 | 184,423 | 178,970 | 190,515 | 192,856 | 181,953 | 195,027 | 187,278 | 193,763 |
| 2011 | 181,473 | 172,040 | 193,628 | 192,642 | 200,511 | 199,531 | 206,204 | 206,752 | 190,751 | 197,065 | 187,778 | 194,924 |
| 2012 | 184,133 | 179,946 | 197,719 | 193,590 | 206,040 | 203,160 | 209,104 | 215,349 | 195,536 | 206,870 | 197,449 | 199,759 |
| 2013 | 193,173 | 182,603 | 206,682 | 207,130 | 218,986 | 213,210 | 217,354 | 220,944 | 208,468 | 225,293 | 214,997 | 218,668 |
| 2014 | 209,969 | 195,557 | 228,272 | 228,702 | 243,760 | 241,062 | 251,475 | 251,962 | 234,578 | 246,407 | 234,075 | 244,623 |
| 2015 | 236,715 | 219,551 | 244,597 | 244,526 | 257,743 | 252,932 | 262,216 | 261,949 | 247,012 | 255,762 | 239,584 | 250,324 |
| 2016 | 240,602 | 237,399 | 256,336 | 252,233 | 266,169 | 262,698 | 268,658 | 270,934 | 253,327 | 260,531 | 249,108 | 257,338 |
| 2017 | 238,490 | 225,901 | 259,057 | 253,217 | 267,838 | 264,729 | 267,579 | 271,364 | 248,353 | 262,671 | 250,750 | 253,602 |
| 2018 | 241,575 | 227,222 | 260,493 | 251,948 | 270,347 | 264,245 | 267,972 | 270,618 | 248,516 | 263,146 | 251,604 | 255,542 |
| 2019 | 244,555 | 225,743 | 259,619 | 255,446 | 270,435 | 261,423 | 269,971 | 275,004 | 248,624 | 262,758 | 250,387 | 251,246 |
| 2020 | 242,838 | 236,120 | 217,649 | 154,439 | 197,330 | 224,043 | 238,603 | 241,626 | 227,986 | 236,495 | 215,635 | 221,252 |
| 2021 | 214,780 | 197,150 | 239,599 | 243,243 | 258,302 | 253,593 | 264,000 | 262,652 | 247,175 | 252,246 | 243,095 | 247,061 |
| 2022 | 223,570 | 220,585 | 250,323 | 244,741 | 261,442 | 250,020 | 252,419 | 260,628 | 245,300 | 251,295 | 241,819 | 243,716 |
| 2023 | 231,325 | 221,136 | 250,948 | 246,322 | 262,607 | 253,517 | 258,676 | 263,410 | 243,584 | 252,340 | 240,533 | 241,077 |
| 2024 | 230,142 | 227,111 | ||||||||||
| - = No Data Reported; -- = Not Applicable; NA = Not Available; W = Withheld to avoid disclosure of individual company data. |
| Release Date: 4/30/2024 |
| Next Release Date: 5/31/2024 |
Referring Pages: