|
Download Data (XLS File) |
|
||||||||
|
||||||||
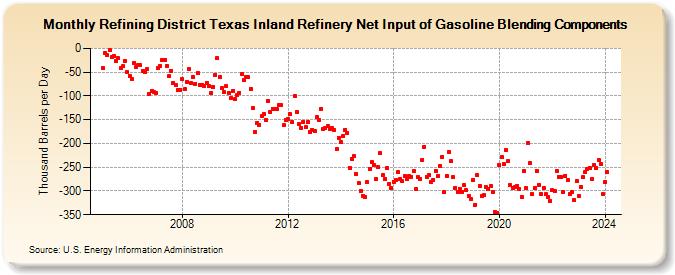
| Refining District Texas Inland Refinery Net Input of Gasoline Blending Components (Thousand Barrels per Day) | ||||||||
| Year | Jan | Feb | Mar | Apr | May | Jun | Jul | Aug | Sep | Oct | Nov | Dec |
|---|---|---|---|---|---|---|---|---|---|---|---|---|
| 2005 | -42 | -9 | -14 | -4 | -18 | -15 | -26 | -21 | -42 | -38 | -26 | -50 |
| 2006 | -58 | -64 | -30 | -40 | -35 | -35 | -48 | -49 | -44 | -95 | -90 | -92 |
| 2007 | -93 | -42 | -38 | -25 | -25 | -37 | -59 | -47 | -72 | -76 | -87 | -87 |
| 2008 | -65 | -86 | -70 | -44 | -72 | -60 | -74 | -52 | -76 | -77 | -79 | -72 |
| 2009 | -80 | -94 | -82 | -55 | -21 | -60 | -84 | -92 | -80 | -94 | -105 | -89 |
| 2010 | -107 | -98 | -93 | -54 | -66 | -61 | -61 | -85 | -126 | -175 | -156 | -161 |
| 2011 | -142 | -138 | -150 | -110 | -133 | -127 | -127 | -128 | -119 | -120 | -162 | -151 |
| 2012 | -148 | -139 | -155 | -101 | -133 | -160 | -167 | -154 | -166 | -155 | -176 | -171 |
| 2013 | -173 | -145 | -150 | -127 | -169 | -168 | -164 | -169 | -168 | -172 | -212 | -188 |
| 2014 | -198 | -184 | -171 | -178 | -251 | -232 | -227 | -264 | -283 | -300 | -310 | -312 |
| 2015 | -282 | -253 | -240 | -246 | -275 | -250 | -221 | -267 | -274 | -252 | -285 | -294 |
| 2016 | -281 | -277 | -261 | -275 | -280 | -269 | -274 | -269 | -270 | -257 | -296 | -271 |
| 2017 | -274 | -234 | -207 | -270 | -267 | -281 | -277 | -257 | -268 | -248 | -228 | -303 |
| 2018 | -268 | -217 | -238 | -271 | -293 | -302 | -295 | -302 | -288 | -299 | -310 | -317 |
| 2019 | -278 | -329 | -267 | -289 | -311 | -309 | -292 | -295 | -290 | -303 | -345 | -346 |
| 2020 | -246 | -229 | -244 | -213 | -238 | -288 | -294 | -292 | -289 | -296 | -313 | -258 |
| 2021 | -294 | -199 | -241 | -307 | -293 | -257 | -287 | -307 | -294 | -307 | -312 | -321 |
| 2022 | -298 | -301 | -257 | -270 | -271 | -303 | -268 | -278 | -306 | -303 | -320 | -280 |
| 2023 | -310 | -291 | -271 | -260 | -254 | -251 | -275 | -245 | -252 | -235 | -243 | -307 |
| 2024 | -281 | -261 | ||||||||||
| - = No Data Reported; -- = Not Applicable; NA = Not Available; W = Withheld to avoid disclosure of individual company data. |
| Release Date: 4/30/2024 |
| Next Release Date: 5/31/2024 |