|
Download Data (XLS File) |
|
||||||||
|
||||||||
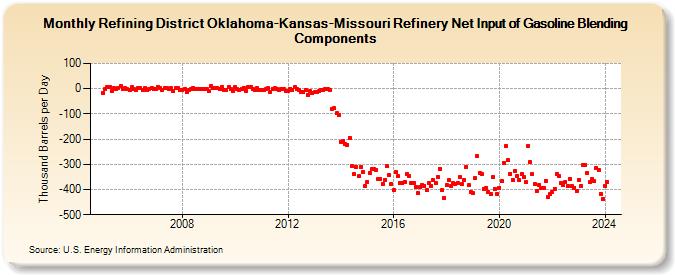
| Refining District Oklahoma-Kansas-Missouri Refinery Net Input of Gasoline Blending Components (Thousand Barrels per Day) | ||||||||
| Year | Jan | Feb | Mar | Apr | May | Jun | Jul | Aug | Sep | Oct | Nov | Dec |
|---|---|---|---|---|---|---|---|---|---|---|---|---|
| 2005 | -16 | -2 | 7 | 6 | -9 | 1 | -3 | 2 | 10 | -1 | 1 | -3 |
| 2006 | -5 | 5 | -3 | -4 | 4 | 3 | -6 | 2 | -7 | -1 | 4 | -2 |
| 2007 | -2 | 7 | 2 | -4 | 2 | 1 | -3 | 1 | -11 | 1 | 2 | -6 |
| 2008 | -4 | -3 | -14 | -7 | -2 | 4 | 0 | -1 | 0 | -2 | -1 | 0 |
| 2009 | -9 | 9 | 1 | 1 | 4 | -3 | 6 | -5 | -5 | 6 | -2 | -8 |
| 2010 | 5 | -2 | -5 | -1 | 4 | -8 | 6 | 6 | -1 | -6 | 1 | -4 |
| 2011 | -6 | -6 | -1 | 3 | -12 | 0 | 1 | -3 | -6 | -2 | -3 | -10 |
| 2012 | -10 | 0 | -4 | 6 | -2 | -6 | -14 | -13 | -7 | -25 | -11 | -16 |
| 2013 | -15 | -14 | -10 | -5 | -4 | 0 | 0 | -5 | -80 | -78 | -98 | -105 |
| 2014 | -210 | -209 | -218 | -222 | -194 | -307 | -339 | -309 | -348 | -310 | -332 | -387 |
| 2015 | -369 | -333 | -319 | -318 | -321 | -359 | -358 | -377 | -361 | -308 | -344 | -378 |
| 2016 | -402 | -330 | -348 | -374 | -374 | -369 | -339 | -348 | -374 | -375 | -391 | -415 |
| 2017 | -391 | -383 | -385 | -403 | -375 | -385 | -364 | -373 | -350 | -317 | -403 | -433 |
| 2018 | -382 | -364 | -386 | -375 | -379 | -374 | -351 | -380 | -362 | -312 | -384 | -411 |
| 2019 | -415 | -356 | -269 | -334 | -337 | -396 | -393 | -410 | -416 | -351 | -398 | -417 |
| 2020 | -394 | -367 | -293 | -227 | -284 | -337 | -362 | -326 | -346 | -363 | -338 | -350 |
| 2021 | -372 | -226 | -292 | -340 | -379 | -407 | -382 | -395 | -395 | -366 | -431 | -419 |
| 2022 | -409 | -396 | -338 | -346 | -373 | -384 | -370 | -385 | -357 | -388 | -393 | -405 |
| 2023 | -362 | -385 | -302 | -301 | -335 | -371 | -359 | -368 | -315 | -323 | -416 | -436 |
| 2024 | -385 | -369 | ||||||||||
| - = No Data Reported; -- = Not Applicable; NA = Not Available; W = Withheld to avoid disclosure of individual company data. |
| Release Date: 4/30/2024 |
| Next Release Date: 5/31/2024 |