|
Download Data (XLS File) |
|
||||||||
|
||||||||
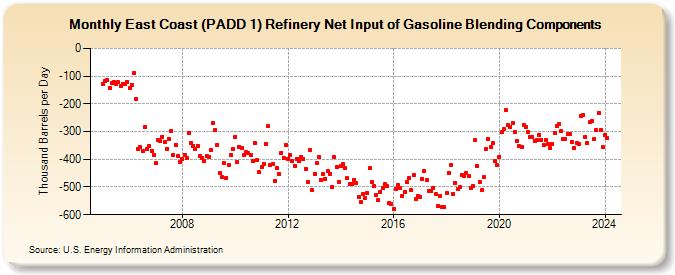
| East Coast (PADD 1) Refinery Net Input of Gasoline Blending Components (Thousand Barrels per Day) | ||||||||
| Year | Jan | Feb | Mar | Apr | May | Jun | Jul | Aug | Sep | Oct | Nov | Dec |
|---|---|---|---|---|---|---|---|---|---|---|---|---|
| 2005 | -127 | -119 | -114 | -142 | -124 | -122 | -128 | -122 | -136 | -128 | -129 | -120 |
| 2006 | -144 | -131 | -88 | -181 | -364 | -357 | -369 | -283 | -363 | -353 | -370 | -384 |
| 2007 | -414 | -332 | -335 | -318 | -337 | -362 | -327 | -298 | -385 | -347 | -389 | -411 |
| 2008 | -400 | -383 | -395 | -304 | -341 | -351 | -364 | -351 | -388 | -394 | -405 | -387 |
| 2009 | -390 | -365 | -270 | -294 | -348 | -449 | -464 | -413 | -467 | -421 | -383 | -364 |
| 2010 | -319 | -411 | -354 | -361 | -383 | -374 | -378 | -383 | -405 | -341 | -403 | -447 |
| 2011 | -427 | -417 | -344 | -281 | -420 | -418 | -479 | -433 | -454 | -377 | -395 | -347 |
| 2012 | -398 | -384 | -406 | -424 | -398 | -407 | -390 | -398 | -435 | -482 | -365 | -511 |
| 2013 | -454 | -413 | -391 | -476 | -454 | -470 | -443 | -454 | -499 | -392 | -428 | -483 |
| 2014 | -424 | -418 | -433 | -469 | -490 | -488 | -473 | -487 | -535 | -555 | -527 | -539 |
| 2015 | -521 | -433 | -483 | -498 | -528 | -546 | -517 | -504 | -491 | -497 | -557 | -560 |
| 2016 | -579 | -507 | -494 | -503 | -532 | -518 | -483 | -469 | -511 | -458 | -545 | -531 |
| 2017 | -535 | -471 | -442 | -474 | -513 | -516 | -502 | -527 | -569 | -532 | -571 | -573 |
| 2018 | -522 | -449 | -421 | -524 | -484 | -508 | -500 | -456 | -459 | -448 | -460 | -505 |
| 2019 | -497 | -329 | -424 | -481 | -512 | -465 | -363 | -326 | -354 | -343 | -407 | -420 |
| 2020 | -390 | -303 | -292 | -224 | -278 | -282 | -270 | -301 | -334 | -353 | -356 | -278 |
| 2021 | -284 | -303 | -319 | -318 | -333 | -332 | -313 | -329 | -348 | -330 | -345 | -361 |
| 2022 | -345 | -304 | -280 | -271 | -299 | -328 | -327 | -310 | -308 | -338 | -359 | -340 |
| 2023 | -345 | -244 | -242 | -319 | -340 | -267 | -262 | -328 | -295 | -233 | -294 | -357 |
| 2024 | -312 | -324 | ||||||||||
| - = No Data Reported; -- = Not Applicable; NA = Not Available; W = Withheld to avoid disclosure of individual company data. |
| Release Date: 4/30/2024 |
| Next Release Date: 5/31/2024 |