|
Download Data (XLS File) |
|
||||||||
|
||||||||
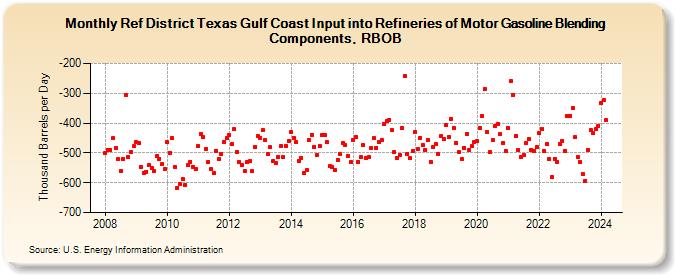
| Ref District Texas Gulf Coast Input into Refineries of Motor Gasoline Blending Components, RBOB (Thousand Barrels per Day) | ||||||||
| Year | Jan | Feb | Mar | Apr | May | Jun | Jul | Aug | Sep | Oct | Nov | Dec |
|---|---|---|---|---|---|---|---|---|---|---|---|---|
| 2008 | -500 | -489 | -491 | -451 | -483 | -522 | -562 | -520 | -305 | -514 | -497 | -478 |
| 2009 | -465 | -467 | -547 | -566 | -563 | -540 | -551 | -562 | -511 | -519 | -536 | -554 |
| 2010 | -464 | -499 | -450 | -547 | -616 | -605 | -589 | -606 | -542 | -529 | -546 | -553 |
| 2011 | -476 | -435 | -447 | -486 | -530 | -555 | -568 | -493 | -521 | -502 | -463 | -449 |
| 2012 | -439 | -471 | -421 | -496 | -531 | -542 | -559 | -532 | -528 | -562 | -479 | -444 |
| 2013 | -449 | -424 | -458 | -502 | -481 | -527 | -534 | -514 | -478 | -515 | -476 | -460 |
| 2014 | -430 | -449 | -465 | -526 | -516 | -567 | -558 | -456 | -439 | -480 | -506 | -476 |
| 2015 | -439 | -440 | -464 | -545 | -548 | -558 | -524 | -505 | -468 | -475 | -510 | -532 |
| 2016 | -455 | -446 | -529 | -514 | -475 | -516 | -514 | -485 | -451 | -482 | -464 | -456 |
| 2017 | -402 | -393 | -388 | -423 | -498 | -516 | -506 | -415 | -242 | -502 | -518 | -494 |
| 2018 | -430 | -488 | -449 | -474 | -491 | -457 | -530 | -480 | -471 | -505 | -444 | -454 |
| 2019 | -408 | -445 | -385 | -417 | -467 | -496 | -520 | -482 | -435 | -490 | -477 | -464 |
| 2020 | -461 | -416 | -376 | -286 | -430 | -497 | -458 | -410 | -402 | -438 | -466 | -492 |
| 2021 | -417 | -259 | -307 | -443 | -490 | -514 | -507 | -466 | -454 | -489 | -492 | -481 |
| 2022 | -433 | -421 | -495 | -470 | -522 | -582 | -520 | -530 | -470 | -460 | -494 | -376 |
| 2023 | -376 | -350 | -448 | -513 | -532 | -570 | -593 | -490 | -424 | -434 | -419 | -409 |
| 2024 | -333 | -324 | ||||||||||
| - = No Data Reported; -- = Not Applicable; NA = Not Available; W = Withheld to avoid disclosure of individual company data. |
| Release Date: 4/30/2024 |
| Next Release Date: 5/31/2024 |