|
Download Data (XLS File) |
|
||||||||
|
||||||||
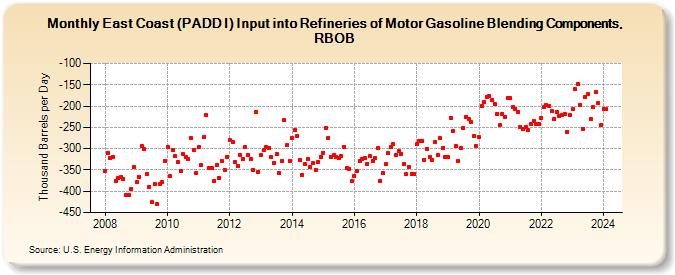
| East Coast (PADD I) Input into Refineries of Motor Gasoline Blending Components, RBOB (Thousand Barrels per Day) | ||||||||
| Year | Jan | Feb | Mar | Apr | May | Jun | Jul | Aug | Sep | Oct | Nov | Dec |
|---|---|---|---|---|---|---|---|---|---|---|---|---|
| 2008 | -352 | -311 | -321 | -319 | -375 | -370 | -367 | -371 | -409 | -409 | -394 | -343 |
| 2009 | -379 | -366 | -294 | -301 | -360 | -389 | -426 | -383 | -430 | -384 | -379 | -329 |
| 2010 | -296 | -365 | -302 | -318 | -331 | -353 | -312 | -319 | -325 | -275 | -303 | -357 |
| 2011 | -296 | -339 | -273 | -221 | -345 | -345 | -376 | -338 | -368 | -329 | -350 | -319 |
| 2012 | -280 | -285 | -331 | -340 | -314 | -324 | -297 | -314 | -325 | -349 | -213 | -355 |
| 2013 | -316 | -304 | -296 | -299 | -320 | -333 | -313 | -357 | -329 | -233 | -292 | -329 |
| 2014 | -275 | -257 | -270 | -327 | -361 | -337 | -324 | -344 | -333 | -349 | -331 | -320 |
| 2015 | -309 | -251 | -274 | -319 | -315 | -319 | -322 | -317 | -295 | -346 | -347 | -377 |
| 2016 | -363 | -352 | -329 | -325 | -322 | -335 | -318 | -328 | -322 | -298 | -376 | -358 |
| 2017 | -337 | -311 | -295 | -290 | -314 | -305 | -312 | -336 | -360 | -342 | -359 | -359 |
| 2018 | -290 | -281 | -281 | -326 | -300 | -320 | -326 | -284 | -315 | -276 | -298 | -320 |
| 2019 | -320 | -228 | -259 | -294 | -329 | -298 | -252 | -225 | -231 | -238 | -271 | -293 |
| 2020 | -273 | -199 | -190 | -179 | -176 | -185 | -194 | -218 | -244 | -218 | -225 | -181 |
| 2021 | -182 | -202 | -206 | -214 | -250 | -254 | -249 | -256 | -241 | -235 | -241 | -241 |
| 2022 | -229 | -203 | -198 | -200 | -212 | -230 | -213 | -224 | -222 | -218 | -260 | -222 |
| 2023 | -208 | -161 | -148 | -197 | -253 | -178 | -171 | -231 | -203 | -167 | -193 | -244 |
| 2024 | -207 | -207 | ||||||||||
| - = No Data Reported; -- = Not Applicable; NA = Not Available; W = Withheld to avoid disclosure of individual company data. |
| Release Date: 4/30/2024 |
| Next Release Date: 5/31/2024 |