|
Download Data (XLS File) |
|
||||||||
|
||||||||
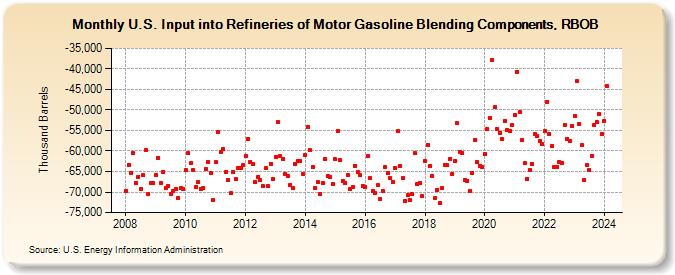
| U.S. Input into Refineries of Motor Gasoline Blending Components, RBOB (Thousand Barrels) | ||||||||
| Year | Jan | Feb | Mar | Apr | May | Jun | Jul | Aug | Sep | Oct | Nov | Dec |
|---|---|---|---|---|---|---|---|---|---|---|---|---|
| 2008 | -69,823 | -63,348 | -65,267 | -60,578 | -67,799 | -66,217 | -69,146 | -65,852 | -59,804 | -70,589 | -67,913 | -67,854 |
| 2009 | -65,816 | -61,590 | -67,766 | -65,057 | -68,962 | -68,443 | -70,548 | -69,678 | -69,244 | -71,434 | -69,069 | -69,269 |
| 2010 | -64,708 | -60,571 | -63,011 | -64,596 | -68,733 | -67,607 | -69,235 | -69,096 | -64,359 | -62,581 | -65,331 | -71,953 |
| 2011 | -62,791 | -55,344 | -60,202 | -59,617 | -65,170 | -67,130 | -70,355 | -65,003 | -66,880 | -64,263 | -64,039 | -63,347 |
| 2012 | -61,170 | -57,087 | -62,630 | -63,067 | -67,516 | -66,244 | -67,177 | -68,632 | -64,086 | -68,618 | -63,100 | -66,716 |
| 2013 | -61,469 | -52,950 | -61,179 | -62,024 | -65,639 | -66,094 | -68,211 | -69,054 | -63,265 | -62,340 | -62,398 | -65,511 |
| 2014 | -60,909 | -54,130 | -59,817 | -63,849 | -69,107 | -67,618 | -70,498 | -67,830 | -61,985 | -66,054 | -66,376 | -67,946 |
| 2015 | -62,062 | -55,008 | -62,275 | -67,353 | -67,829 | -65,729 | -69,361 | -68,781 | -63,646 | -65,184 | -65,930 | -68,436 |
| 2016 | -68,809 | -61,283 | -66,682 | -69,811 | -70,283 | -68,362 | -71,707 | -69,816 | -63,812 | -65,298 | -66,653 | -67,517 |
| 2017 | -64,116 | -55,211 | -63,559 | -66,644 | -72,136 | -70,744 | -72,052 | -70,590 | -60,558 | -68,071 | -67,779 | -70,916 |
| 2018 | -62,464 | -58,531 | -63,644 | -66,060 | -71,371 | -69,507 | -72,737 | -69,097 | -63,299 | -63,385 | -61,934 | -65,613 |
| 2019 | -62,334 | -53,269 | -60,123 | -60,428 | -67,173 | -67,244 | -69,661 | -65,415 | -57,289 | -62,709 | -63,540 | -63,894 |
| 2020 | -60,642 | -54,654 | -51,905 | -37,889 | -49,316 | -54,719 | -55,518 | -57,074 | -52,604 | -54,859 | -55,119 | -53,586 |
| 2021 | -51,222 | -40,641 | -50,526 | -57,402 | -63,042 | -66,719 | -64,668 | -63,129 | -55,742 | -56,421 | -57,519 | -58,374 |
| 2022 | -55,244 | -47,985 | -55,878 | -58,821 | -63,955 | -63,802 | -62,632 | -62,893 | -53,615 | -57,050 | -57,534 | -53,947 |
| 2023 | -51,594 | -43,038 | -53,346 | -58,635 | -67,180 | -63,485 | -64,530 | -61,270 | -53,558 | -53,048 | -50,983 | -55,815 |
| 2024 | -52,611 | -44,206 | -51,890 | -60,050 | -65,451 | -62,929 | ||||||
| - = No Data Reported; -- = Not Applicable; NA = Not Available; W = Withheld to avoid disclosure of individual company data. |
| Release Date: 8/30/2024 |
| Next Release Date: 9/30/2024 |