|
Download Data (XLS File) |
|
||||||||
|
||||||||
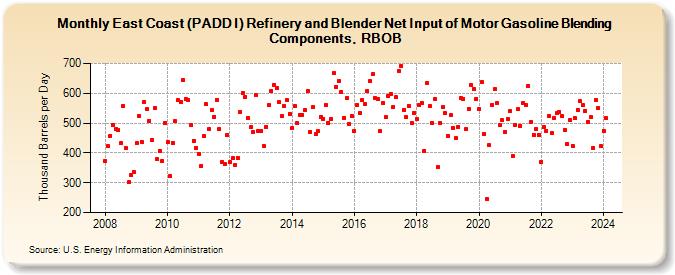
| East Coast (PADD I) Refinery and Blender Net Input of Motor Gasoline Blending Components, RBOB (Thousand Barrels per Day) | ||||||||
| Year | Jan | Feb | Mar | Apr | May | Jun | Jul | Aug | Sep | Oct | Nov | Dec |
|---|---|---|---|---|---|---|---|---|---|---|---|---|
| 2008 | 374 | 422 | 457 | 495 | 480 | 477 | 432 | 557 | 417 | 301 | 325 | 335 |
| 2009 | 433 | 525 | 437 | 571 | 547 | 508 | 444 | 551 | 378 | 408 | 373 | 502 |
| 2010 | 436 | 322 | 434 | 506 | 578 | 570 | 645 | 581 | 578 | 494 | 441 | 416 |
| 2011 | 398 | 356 | 458 | 563 | 481 | 543 | 522 | 579 | 480 | 370 | 364 | 460 |
| 2012 | 368 | 382 | 360 | 383 | 537 | 601 | 588 | 518 | 486 | 471 | 593 | 474 |
| 2013 | 474 | 424 | 488 | 560 | 607 | 629 | 619 | 570 | 523 | 557 | 577 | 530 |
| 2014 | 483 | 557 | 499 | 528 | 528 | 544 | 607 | 471 | 554 | 462 | 472 | 522 |
| 2015 | 515 | 560 | 501 | 515 | 668 | 622 | 642 | 603 | 518 | 583 | 498 | 525 |
| 2016 | 475 | 560 | 534 | 578 | 564 | 607 | 640 | 664 | 584 | 581 | 473 | 568 |
| 2017 | 519 | 590 | 599 | 555 | 586 | 675 | 693 | 545 | 519 | 559 | 501 | 535 |
| 2018 | 514 | 561 | 567 | 407 | 636 | 558 | 502 | 581 | 353 | 501 | 553 | 533 |
| 2019 | 458 | 526 | 484 | 450 | 488 | 585 | 582 | 480 | 549 | 627 | 615 | 581 |
| 2020 | 547 | 638 | 464 | 246 | 425 | 562 | 613 | 567 | 493 | 509 | 471 | 513 |
| 2021 | 539 | 390 | 495 | 546 | 490 | 568 | 561 | 626 | 504 | 461 | 480 | 461 |
| 2022 | 371 | 487 | 475 | 525 | 466 | 517 | 533 | 538 | 523 | 477 | 430 | 511 |
| 2023 | 424 | 516 | 545 | 573 | 561 | 542 | 504 | 521 | 417 | 576 | 550 | 422 |
| 2024 | 475 | |||||||||||
| - = No Data Reported; -- = Not Applicable; NA = Not Available; W = Withheld to avoid disclosure of individual company data. |
| Release Date: 3/29/2024 |
| Next Release Date: 4/30/2024 |