|
Download Data (XLS File) |
|
||||||||
|
||||||||
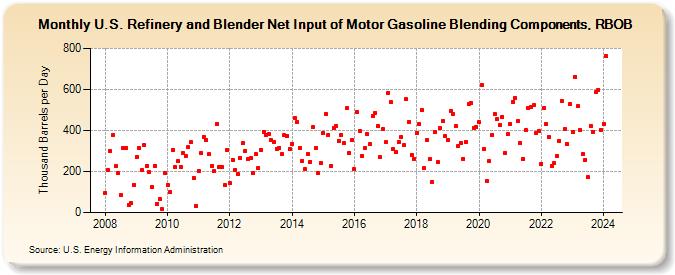
| U.S. Refinery and Blender Net Input of Motor Gasoline Blending Components, RBOB (Thousand Barrels per Day) | ||||||||
| Year | Jan | Feb | Mar | Apr | May | Jun | Jul | Aug | Sep | Oct | Nov | Dec |
|---|---|---|---|---|---|---|---|---|---|---|---|---|
| 2008 | 97 | 207 | 298 | 378 | 225 | 191 | 84 | 317 | 315 | 38 | 46 | 136 |
| 2009 | 270 | 316 | 205 | 328 | 227 | 198 | 123 | 229 | 43 | 64 | 15 | 192 |
| 2010 | 135 | 99 | 304 | 221 | 250 | 224 | 291 | 274 | 318 | 342 | 170 | 32 |
| 2011 | 203 | 290 | 370 | 354 | 284 | 226 | 202 | 431 | 221 | 223 | 134 | 305 |
| 2012 | 143 | 258 | 209 | 188 | 268 | 337 | 300 | 261 | 266 | 192 | 285 | 219 |
| 2013 | 306 | 395 | 380 | 384 | 352 | 342 | 311 | 317 | 285 | 376 | 373 | 310 |
| 2014 | 336 | 460 | 441 | 314 | 253 | 210 | 287 | 248 | 415 | 313 | 192 | 241 |
| 2015 | 387 | 481 | 380 | 228 | 412 | 422 | 351 | 380 | 337 | 508 | 291 | 354 |
| 2016 | 211 | 491 | 397 | 278 | 316 | 381 | 332 | 472 | 487 | 423 | 269 | 407 |
| 2017 | 342 | 584 | 538 | 308 | 294 | 343 | 368 | 329 | 552 | 442 | 282 | 261 |
| 2018 | 390 | 432 | 500 | 217 | 353 | 262 | 149 | 392 | 244 | 410 | 445 | 373 |
| 2019 | 353 | 497 | 481 | 420 | 322 | 341 | 263 | 344 | 529 | 533 | 414 | 417 |
| 2020 | 439 | 621 | 310 | 152 | 249 | 380 | 481 | 454 | 429 | 468 | 292 | 381 |
| 2021 | 431 | 541 | 559 | 444 | 337 | 262 | 400 | 509 | 514 | 522 | 386 | 396 |
| 2022 | 238 | 509 | 431 | 368 | 229 | 241 | 275 | 349 | 544 | 406 | 334 | 527 |
| 2023 | 393 | 663 | 518 | 402 | 285 | 258 | 171 | 421 | 395 | 586 | 599 | 404 |
| 2024 | 431 | |||||||||||
| - = No Data Reported; -- = Not Applicable; NA = Not Available; W = Withheld to avoid disclosure of individual company data. |
| Release Date: 3/29/2024 |
| Next Release Date: 4/30/2024 |