|
Download Data (XLS File) |
|
||||||||
|
||||||||
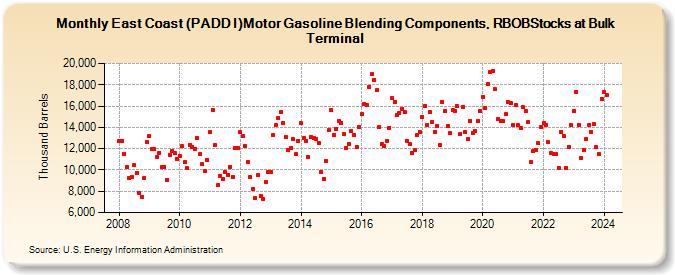
| East Coast (PADD I)Motor Gasoline Blending Components, RBOBStocks at Bulk Terminal (Thousand Barrels) | ||||||||
| Year | Jan | Feb | Mar | Apr | May | Jun | Jul | Aug | Sep | Oct | Nov | Dec |
|---|---|---|---|---|---|---|---|---|---|---|---|---|
| 2008 | 12,740 | 12,734 | 11,488 | 10,236 | 9,240 | 9,345 | 10,441 | 9,752 | 7,838 | 7,495 | 9,258 | 12,664 |
| 2009 | 13,187 | 11,980 | 12,010 | 11,186 | 11,639 | 10,233 | 10,306 | 9,081 | 11,429 | 11,798 | 11,557 | 11,055 |
| 2010 | 11,337 | 12,227 | 10,724 | 10,180 | 12,376 | 12,202 | 12,009 | 12,994 | 11,458 | 10,515 | 9,871 | 10,931 |
| 2011 | 13,523 | 15,662 | 12,338 | 8,550 | 9,467 | 9,157 | 9,787 | 9,564 | 10,299 | 9,372 | 12,102 | 12,090 |
| 2012 | 13,520 | 13,178 | 12,288 | 10,786 | 9,326 | 8,214 | 7,397 | 9,514 | 7,560 | 7,272 | 8,897 | 9,796 |
| 2013 | 9,774 | 13,286 | 14,197 | 14,881 | 15,443 | 14,454 | 13,103 | 11,898 | 12,106 | 12,879 | 11,477 | 12,734 |
| 2014 | 14,407 | 13,028 | 12,757 | 11,256 | 13,133 | 12,975 | 12,952 | 12,524 | 9,795 | 9,166 | 10,873 | 13,721 |
| 2015 | 15,590 | 13,327 | 13,833 | 14,618 | 14,433 | 13,381 | 12,027 | 12,478 | 13,667 | 13,280 | 12,158 | 14,007 |
| 2016 | 15,242 | 16,232 | 16,123 | 17,817 | 18,969 | 18,473 | 17,494 | 13,999 | 12,438 | 12,220 | 12,752 | 13,985 |
| 2017 | 16,802 | 16,364 | 15,139 | 15,329 | 15,736 | 15,418 | 12,756 | 12,472 | 11,551 | 11,845 | 13,302 | 13,581 |
| 2018 | 14,980 | 16,037 | 14,235 | 15,465 | 14,532 | 13,543 | 14,154 | 12,369 | 16,380 | 15,546 | 14,106 | 13,436 |
| 2019 | 15,604 | 15,533 | 15,974 | 13,366 | 15,916 | 13,524 | 12,949 | 14,642 | 13,477 | 13,665 | 14,562 | 15,492 |
| 2020 | 16,857 | 15,830 | 18,075 | 19,233 | 19,276 | 17,557 | 14,757 | 14,645 | 14,590 | 15,219 | 16,360 | 16,245 |
| 2021 | 14,221 | 16,080 | 14,194 | 13,895 | 15,898 | 15,549 | 14,487 | 10,765 | 11,824 | 11,878 | 12,531 | 14,027 |
| 2022 | 14,407 | 14,253 | 12,598 | 11,578 | 11,454 | 11,470 | 10,169 | 13,562 | 13,175 | 10,228 | 12,165 | 14,191 |
| 2023 | 15,554 | 17,298 | 14,225 | 11,082 | 11,902 | 12,890 | 14,224 | 13,578 | 14,287 | 12,123 | 11,480 | 16,692 |
| 2024 | 17,359 | |||||||||||
| - = No Data Reported; -- = Not Applicable; NA = Not Available; W = Withheld to avoid disclosure of individual company data. |
| Release Date: 3/29/2024 |
| Next Release Date: 4/30/2024 |