|
Download Data (XLS File) |
|
||||||||
|
||||||||
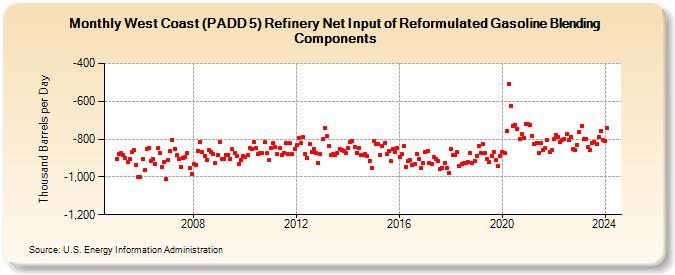
| West Coast (PADD 5) Refinery Net Input of Reformulated Gasoline Blending Components (Thousand Barrels per Day) | ||||||||
| Year | Jan | Feb | Mar | Apr | May | Jun | Jul | Aug | Sep | Oct | Nov | Dec |
|---|---|---|---|---|---|---|---|---|---|---|---|---|
| 2005 | -907 | -881 | -871 | -885 | -900 | -922 | -907 | -868 | -860 | -936 | -1,000 | -1,003 |
| 2006 | -904 | -963 | -851 | -845 | -914 | -903 | -933 | -849 | -872 | -949 | -922 | -1,011 |
| 2007 | -912 | -862 | -806 | -850 | -886 | -907 | -945 | -902 | -894 | -874 | -953 | -987 |
| 2008 | -934 | -935 | -861 | -816 | -870 | -887 | -910 | -856 | -868 | -879 | -924 | -883 |
| 2009 | -814 | -905 | -906 | -882 | -883 | -906 | -854 | -873 | -890 | -930 | -911 | -887 |
| 2010 | -894 | -883 | -847 | -853 | -817 | -849 | -878 | -871 | -876 | -816 | -875 | -909 |
| 2011 | -846 | -820 | -844 | -878 | -845 | -884 | -873 | -822 | -881 | -822 | -881 | -850 |
| 2012 | -830 | -796 | -823 | -789 | -879 | -900 | -824 | -869 | -853 | -876 | -924 | -881 |
| 2013 | -801 | -741 | -781 | -835 | -885 | -881 | -883 | -876 | -850 | -858 | -863 | -874 |
| 2014 | -848 | -813 | -809 | -843 | -871 | -848 | -882 | -884 | -877 | -891 | -914 | -952 |
| 2015 | -811 | -827 | -827 | -884 | -835 | -820 | -880 | -862 | -918 | -850 | -867 | -846 |
| 2016 | -893 | -881 | -839 | -948 | -917 | -912 | -938 | -931 | -880 | -904 | -951 | -926 |
| 2017 | -868 | -861 | -927 | -931 | -897 | -905 | -914 | -956 | -952 | -925 | -951 | -980 |
| 2018 | -851 | -884 | -886 | -870 | -942 | -934 | -927 | -929 | -922 | -875 | -925 | -914 |
| 2019 | -888 | -836 | -876 | -828 | -873 | -906 | -922 | -889 | -866 | -913 | -943 | -890 |
| 2020 | -868 | -876 | -755 | -508 | -624 | -729 | -723 | -745 | -798 | -775 | -793 | -721 |
| 2021 | -722 | -726 | -782 | -826 | -819 | -876 | -822 | -856 | -849 | -803 | -866 | -859 |
| 2022 | -801 | -779 | -790 | -817 | -806 | -799 | -775 | -804 | -789 | -850 | -857 | -831 |
| 2023 | -762 | -730 | -797 | -797 | -840 | -856 | -820 | -814 | -827 | -788 | -758 | -806 |
| 2024 | -809 | -743 | ||||||||||
| - = No Data Reported; -- = Not Applicable; NA = Not Available; W = Withheld to avoid disclosure of individual company data. |
| Release Date: 4/30/2024 |
| Next Release Date: 5/31/2024 |