|
Download Data (XLS File) |
|
||||||||
|
||||||||
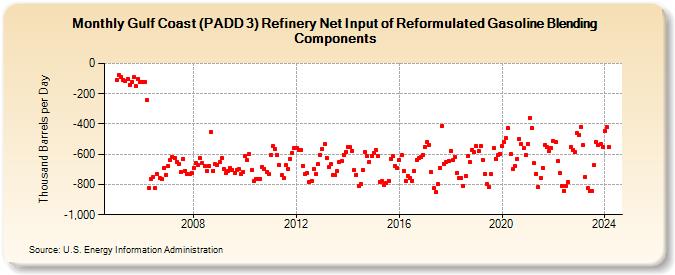
| Gulf Coast (PADD 3) Refinery Net Input of Reformulated Gasoline Blending Components (Thousand Barrels per Day) | ||||||||
| Year | Jan | Feb | Mar | Apr | May | Jun | Jul | Aug | Sep | Oct | Nov | Dec |
|---|---|---|---|---|---|---|---|---|---|---|---|---|
| 2005 | -106 | -78 | -90 | -106 | -119 | -104 | -140 | -121 | -92 | -151 | -101 | -124 |
| 2006 | -123 | -122 | -242 | -823 | -762 | -748 | -824 | -733 | -758 | -764 | -688 | -735 |
| 2007 | -680 | -635 | -620 | -623 | -649 | -662 | -715 | -630 | -708 | -732 | -731 | -722 |
| 2008 | -690 | -659 | -672 | -628 | -661 | -679 | -710 | -676 | -451 | -708 | -666 | -670 |
| 2009 | -653 | -627 | -699 | -726 | -709 | -693 | -704 | -722 | -703 | -700 | -732 | -719 |
| 2010 | -613 | -640 | -600 | -703 | -778 | -767 | -767 | -762 | -685 | -696 | -717 | -734 |
| 2011 | -605 | -548 | -566 | -602 | -668 | -740 | -760 | -673 | -699 | -630 | -591 | -558 |
| 2012 | -558 | -571 | -570 | -675 | -733 | -724 | -784 | -775 | -697 | -731 | -666 | -604 |
| 2013 | -566 | -534 | -624 | -685 | -667 | -735 | -738 | -711 | -654 | -646 | -605 | -584 |
| 2014 | -550 | -554 | -576 | -705 | -735 | -809 | -797 | -702 | -585 | -612 | -651 | -612 |
| 2015 | -591 | -571 | -612 | -783 | -777 | -805 | -790 | -775 | -630 | -613 | -676 | -694 |
| 2016 | -637 | -608 | -709 | -778 | -745 | -757 | -774 | -711 | -635 | -627 | -618 | -602 |
| 2017 | -551 | -519 | -539 | -718 | -826 | -852 | -799 | -689 | -413 | -663 | -650 | -644 |
| 2018 | -580 | -639 | -620 | -722 | -759 | -757 | -807 | -743 | -615 | -653 | -570 | -587 |
| 2019 | -547 | -581 | -544 | -636 | -728 | -800 | -817 | -734 | -559 | -630 | -606 | -596 |
| 2020 | -547 | -520 | -496 | -429 | -600 | -699 | -677 | -629 | -498 | -533 | -561 | -604 |
| 2021 | -531 | -358 | -425 | -660 | -729 | -819 | -758 | -688 | -537 | -554 | -581 | -560 |
| 2022 | -512 | -520 | -646 | -722 | -808 | -841 | -807 | -784 | -555 | -569 | -587 | -462 |
| 2023 | -471 | -418 | -542 | -750 | -824 | -845 | -844 | -673 | -520 | -537 | -533 | -549 |
| 2024 | -448 | -422 | ||||||||||
| - = No Data Reported; -- = Not Applicable; NA = Not Available; W = Withheld to avoid disclosure of individual company data. |
| Release Date: 4/30/2024 |
| Next Release Date: 5/31/2024 |