|
Download Data (XLS File) |
|
||||||||
|
||||||||
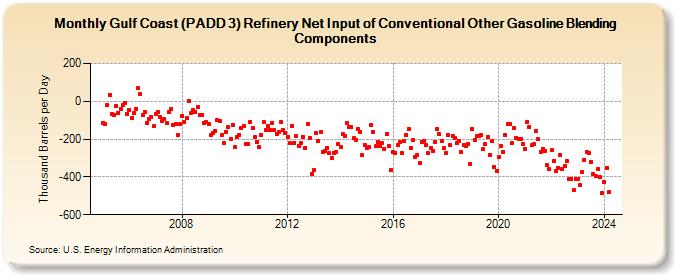
| Gulf Coast (PADD 3) Refinery Net Input of Conventional Other Gasoline Blending Components (Thousand Barrels per Day) | ||||||||
| Year | Jan | Feb | Mar | Apr | May | Jun | Jul | Aug | Sep | Oct | Nov | Dec |
|---|---|---|---|---|---|---|---|---|---|---|---|---|
| 2005 | -113 | -120 | -22 | 35 | -66 | -72 | -27 | -60 | -40 | -21 | -8 | -65 |
| 2006 | -44 | -91 | -62 | -40 | 70 | 37 | -73 | -57 | -113 | -96 | -85 | -132 |
| 2007 | -69 | -56 | -84 | -103 | -95 | -114 | -55 | -41 | -126 | -121 | -178 | -122 |
| 2008 | -78 | -107 | -87 | 3 | -62 | -47 | -56 | -29 | -74 | -71 | -116 | -110 |
| 2009 | -122 | -179 | -167 | -155 | -100 | -103 | -180 | -221 | -161 | -137 | -199 | -125 |
| 2010 | -244 | -188 | -177 | -142 | -130 | -228 | -224 | -108 | -143 | -189 | -215 | -242 |
| 2011 | -180 | -107 | -152 | -131 | -152 | -113 | -153 | -171 | -160 | -110 | -153 | -166 |
| 2012 | -189 | -221 | -129 | -220 | -181 | -235 | -223 | -187 | -245 | -121 | -192 | -383 |
| 2013 | -361 | -168 | -210 | -165 | -268 | -265 | -246 | -275 | -299 | -272 | -268 | -226 |
| 2014 | -243 | -175 | -182 | -113 | -134 | -137 | -196 | -203 | -147 | -163 | -286 | -232 |
| 2015 | -246 | -241 | -126 | -161 | -238 | -216 | -237 | -221 | -253 | -173 | -238 | -365 |
| 2016 | -270 | -271 | -232 | -214 | -275 | -210 | -178 | -144 | -245 | -204 | -297 | -285 |
| 2017 | -326 | -214 | -209 | -232 | -275 | -248 | -264 | -217 | -147 | -175 | -209 | -245 |
| 2018 | -273 | -179 | -232 | -182 | -194 | -221 | -210 | -268 | -232 | -237 | -227 | -331 |
| 2019 | -148 | -205 | -186 | -185 | -178 | -255 | -226 | -191 | -282 | -208 | -349 | -368 |
| 2020 | -297 | -236 | -269 | -180 | -119 | -122 | -222 | -141 | -196 | -197 | -198 | -226 |
| 2021 | -251 | -107 | -137 | -233 | -228 | -157 | -200 | -268 | -250 | -263 | -338 | -360 |
| 2022 | -260 | -317 | -368 | -352 | -284 | -359 | -340 | -315 | -413 | -411 | -469 | -409 |
| 2023 | -413 | -444 | -375 | -310 | -267 | -276 | -319 | -384 | -396 | -358 | -402 | -487 |
| 2024 | -427 | -351 | ||||||||||
| - = No Data Reported; -- = Not Applicable; NA = Not Available; W = Withheld to avoid disclosure of individual company data. |
| Release Date: 4/30/2024 |
| Next Release Date: 5/31/2024 |