|
Download Data (XLS File) |
|
||||||||
|
||||||||
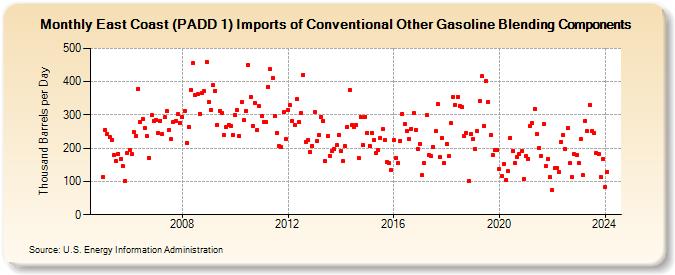
| East Coast (PADD 1) Imports of Conventional Other Gasoline Blending Components (Thousand Barrels per Day) | ||||||||
| Year | Jan | Feb | Mar | Apr | May | Jun | Jul | Aug | Sep | Oct | Nov | Dec |
|---|---|---|---|---|---|---|---|---|---|---|---|---|
| 2005 | 114 | 256 | 242 | 233 | 225 | 180 | 161 | 184 | 168 | 147 | 102 | 185 |
| 2006 | 196 | 183 | 248 | 237 | 379 | 280 | 289 | 261 | 237 | 170 | 300 | 282 |
| 2007 | 286 | 245 | 283 | 243 | 293 | 311 | 256 | 227 | 278 | 281 | 302 | 275 |
| 2008 | 293 | 312 | 216 | 263 | 375 | 455 | 359 | 362 | 304 | 365 | 371 | 460 |
| 2009 | 339 | 315 | 389 | 373 | 269 | 312 | 307 | 239 | 264 | 270 | 268 | 241 |
| 2010 | 300 | 314 | 237 | 339 | 284 | 312 | 449 | 354 | 266 | 336 | 254 | 326 |
| 2011 | 297 | 280 | 280 | 385 | 437 | 411 | 296 | 247 | 207 | 203 | 308 | 227 |
| 2012 | 315 | 329 | 282 | 269 | 347 | 278 | 305 | 421 | 220 | 224 | 190 | 208 |
| 2013 | 308 | 221 | 240 | 294 | 283 | 160 | 236 | 178 | 191 | 197 | 209 | 240 |
| 2014 | 191 | 161 | 206 | 265 | 376 | 269 | 265 | 271 | 170 | 295 | 209 | 294 |
| 2015 | 246 | 208 | 247 | 224 | 185 | 194 | 230 | 257 | 224 | 158 | 155 | 134 |
| 2016 | 224 | 171 | 156 | 223 | 304 | 272 | 252 | 228 | 259 | 305 | 256 | 199 |
| 2017 | 214 | 118 | 154 | 299 | 180 | 176 | 203 | 251 | 333 | 173 | 231 | 156 |
| 2018 | 214 | 176 | 275 | 354 | 330 | 355 | 327 | 325 | 236 | 247 | 102 | 243 |
| 2019 | 227 | 198 | 252 | 343 | 416 | 267 | 401 | 339 | 239 | 180 | 196 | 194 |
| 2020 | 138 | 116 | 152 | 105 | 130 | 232 | 192 | 156 | 175 | 182 | 192 | 108 |
| 2021 | 176 | 168 | 268 | 275 | 319 | 243 | 201 | 178 | 272 | 146 | 168 | 113 |
| 2022 | 73 | 139 | 141 | 128 | 220 | 240 | 197 | 260 | 155 | 113 | 182 | 179 |
| 2023 | 156 | 228 | 118 | 283 | 251 | 331 | 252 | 246 | 186 | 182 | 114 | 166 |
| 2024 | 82 | |||||||||||
| - = No Data Reported; -- = Not Applicable; NA = Not Available; W = Withheld to avoid disclosure of individual company data. |
| Release Date: 3/29/2024 |
| Next Release Date: 4/30/2024 |