|
Download Data (XLS File) |
|
||||||||
|
||||||||
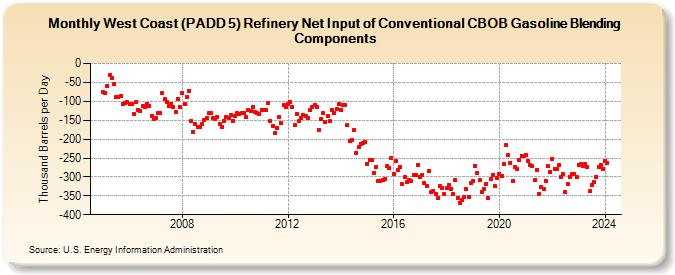
| West Coast (PADD 5) Refinery Net Input of Conventional CBOB Gasoline Blending Components (Thousand Barrels per Day) | ||||||||
| Year | Jan | Feb | Mar | Apr | May | Jun | Jul | Aug | Sep | Oct | Nov | Dec |
|---|---|---|---|---|---|---|---|---|---|---|---|---|
| 2005 | -76 | -78 | -59 | -31 | -39 | -55 | -89 | -88 | -87 | -107 | -105 | -103 |
| 2006 | -108 | -106 | -134 | -101 | -123 | -125 | -113 | -115 | -106 | -112 | -139 | -146 |
| 2007 | -143 | -131 | -131 | -79 | -95 | -103 | -113 | -107 | -116 | -128 | -93 | -116 |
| 2008 | -77 | -106 | -88 | -73 | -152 | -181 | -161 | -169 | -168 | -161 | -149 | -143 |
| 2009 | -131 | -130 | -145 | -148 | -141 | -160 | -167 | -152 | -141 | -143 | -136 | -152 |
| 2010 | -140 | -132 | -134 | -132 | -132 | -142 | -123 | -127 | -114 | -128 | -132 | -134 |
| 2011 | -123 | -122 | -124 | -105 | -151 | -165 | -184 | -171 | -142 | -158 | -110 | -114 |
| 2012 | -106 | -103 | -115 | -164 | -134 | -153 | -145 | -136 | -140 | -144 | -124 | -115 |
| 2013 | -109 | -114 | -175 | -147 | -132 | -156 | -138 | -153 | -122 | -131 | -120 | -107 |
| 2014 | -123 | -109 | -110 | -164 | -204 | -203 | -176 | -238 | -221 | -212 | -211 | -207 |
| 2015 | -265 | -255 | -254 | -289 | -274 | -310 | -310 | -308 | -305 | -272 | -276 | -250 |
| 2016 | -292 | -259 | -281 | -275 | -320 | -300 | -313 | -309 | -312 | -296 | -295 | -268 |
| 2017 | -299 | -296 | -317 | -324 | -284 | -341 | -337 | -344 | -355 | -325 | -329 | -346 |
| 2018 | -329 | -322 | -332 | -346 | -309 | -355 | -368 | -362 | -354 | -332 | -353 | -317 |
| 2019 | -311 | -271 | -289 | -309 | -340 | -331 | -318 | -357 | -305 | -296 | -325 | -303 |
| 2020 | -291 | -298 | -266 | -216 | -243 | -262 | -311 | -273 | -279 | -254 | -244 | -245 |
| 2021 | -243 | -257 | -269 | -272 | -309 | -282 | -345 | -328 | -332 | -310 | -270 | -286 |
| 2022 | -252 | -279 | -280 | -269 | -299 | -292 | -340 | -320 | -299 | -292 | -292 | -301 |
| 2023 | -268 | -267 | -271 | -267 | -274 | -338 | -321 | -313 | -300 | -274 | -269 | -278 |
| 2024 | -257 | -264 | ||||||||||
| - = No Data Reported; -- = Not Applicable; NA = Not Available; W = Withheld to avoid disclosure of individual company data. |
| Release Date: 4/30/2024 |
| Next Release Date: 5/31/2024 |