|
Download Data (XLS File) |
|
||||||||
|
||||||||
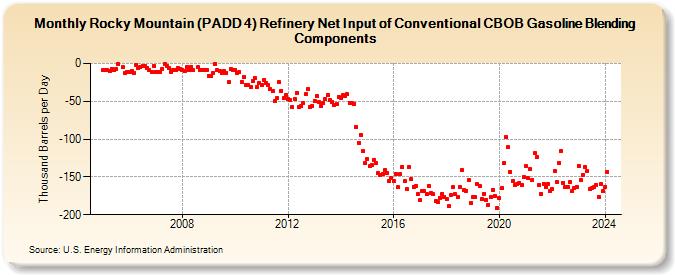
| Rocky Mountain (PADD 4) Refinery Net Input of Conventional CBOB Gasoline Blending Components (Thousand Barrels per Day) | ||||||||
| Year | Jan | Feb | Mar | Apr | May | Jun | Jul | Aug | Sep | Oct | Nov | Dec |
|---|---|---|---|---|---|---|---|---|---|---|---|---|
| 2005 | -9 | -8 | -9 | -10 | -7 | -9 | -7 | -1 | -5 | -12 | -11 | |
| 2006 | -11 | -10 | -12 | -2 | -6 | -5 | -3 | -3 | -6 | -9 | -11 | -3 |
| 2007 | -11 | -11 | -11 | -7 | -1 | -3 | -6 | -11 | -8 | -9 | -6 | -7 |
| 2008 | -8 | -10 | -5 | -9 | -4 | -9 | -5 | -9 | -8 | -9 | -9 | |
| 2009 | -16 | -17 | -12 | -1 | -9 | -10 | -12 | -10 | -12 | -25 | -7 | -9 |
| 2010 | -8 | -12 | -11 | -24 | -18 | -29 | -29 | -31 | -23 | -19 | -31 | -26 |
| 2011 | -28 | -22 | -26 | -29 | -34 | -37 | -49 | -46 | -25 | -36 | -46 | -42 |
| 2012 | -47 | -48 | -58 | -47 | -39 | -58 | -56 | -52 | -41 | -34 | -57 | -56 |
| 2013 | -49 | -43 | -51 | -56 | -52 | -47 | -42 | -48 | -51 | -55 | -53 | -44 |
| 2014 | -45 | -42 | -43 | -41 | -52 | -52 | -53 | -84 | -105 | -94 | -116 | -132 |
| 2015 | -126 | -136 | -134 | -127 | -132 | -145 | -147 | -146 | -141 | -145 | -155 | -152 |
| 2016 | -156 | -146 | -164 | -146 | -137 | -156 | -166 | -137 | -153 | -163 | -162 | -173 |
| 2017 | -181 | -169 | -169 | -173 | -162 | -171 | -173 | -182 | -183 | -178 | -172 | -176 |
| 2018 | -179 | -189 | -174 | -164 | -173 | -176 | -164 | -141 | -167 | -168 | -154 | -184 |
| 2019 | -177 | -177 | -160 | -162 | -179 | -172 | -180 | -187 | -177 | -167 | -175 | -191 |
| 2020 | -178 | -165 | -132 | -97 | -111 | -143 | -156 | -161 | -160 | -158 | -161 | -150 |
| 2021 | -136 | -152 | -140 | -154 | -119 | -124 | -161 | -172 | -159 | -163 | -159 | -168 |
| 2022 | -166 | -142 | -157 | -131 | -116 | -158 | -163 | -163 | -157 | -169 | -165 | -163 |
| 2023 | -135 | -154 | -147 | -137 | -142 | -166 | -165 | -164 | -161 | -176 | -160 | -169 |
| 2024 | -163 | -143 | ||||||||||
| - = No Data Reported; -- = Not Applicable; NA = Not Available; W = Withheld to avoid disclosure of individual company data. |
| Release Date: 4/30/2024 |
| Next Release Date: 5/31/2024 |