|
Download Data (XLS File) |
|
||||||||
|
||||||||
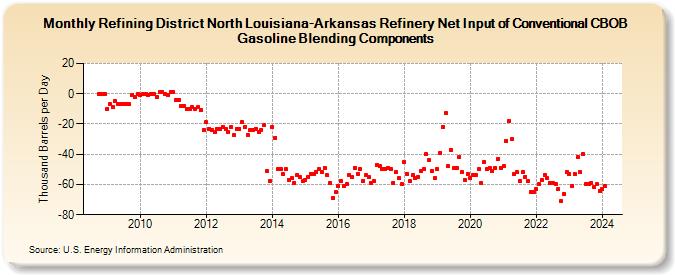
| Refining District North Louisiana-Arkansas Refinery Net Input of Conventional CBOB Gasoline Blending Components (Thousand Barrels per Day) | ||||||||
| Year | Jan | Feb | Mar | Apr | May | Jun | Jul | Aug | Sep | Oct | Nov | Dec |
|---|---|---|---|---|---|---|---|---|---|---|---|---|
| 2008 | 0 | 0 | 0 | |||||||||
| 2009 | -10 | -7 | -9 | -5 | -7 | -7 | -7 | -7 | -7 | -1 | -2 | 0 |
| 2010 | -1 | 0 | 0 | -1 | 0 | 0 | -2 | 1 | 1 | 0 | -1 | 1 |
| 2011 | 1 | -4 | -4 | -8 | -8 | -10 | -10 | -9 | -10 | -9 | -11 | -24 |
| 2012 | -19 | -23 | -24 | -25 | -23 | -23 | -22 | -23 | -25 | -22 | -27 | -23 |
| 2013 | -23 | -19 | -22 | -27 | -24 | -24 | -23 | -25 | -24 | -21 | -51 | -58 |
| 2014 | -22 | -29 | -50 | -50 | -53 | -50 | -57 | -56 | -59 | -54 | -55 | -58 |
| 2015 | -57 | -55 | -53 | -53 | -52 | -50 | -52 | -49 | -54 | -59 | -69 | -65 |
| 2016 | -61 | -58 | -61 | -60 | -54 | -55 | -49 | -53 | -50 | -58 | -54 | -55 |
| 2017 | -59 | -58 | -47 | -48 | -50 | -50 | -49 | -50 | -59 | -52 | -56 | -60 |
| 2018 | -45 | -53 | -58 | -54 | -56 | -55 | -51 | -50 | -40 | -44 | -51 | -56 |
| 2019 | -50 | -39 | -22 | -13 | -48 | -37 | -49 | -49 | -42 | -52 | -57 | -53 |
| 2020 | -56 | -54 | -54 | -50 | -59 | -45 | -50 | -49 | -51 | -49 | -43 | -49 |
| 2021 | -48 | -31 | -18 | -30 | -53 | -52 | -58 | -52 | -55 | -58 | -65 | -65 |
| 2022 | -63 | -60 | -57 | -54 | -56 | -59 | -59 | -60 | -63 | -71 | -66 | -52 |
| 2023 | -53 | -61 | -53 | -42 | -52 | -40 | -60 | -60 | -59 | -62 | -60 | -64 |
| 2024 | -63 | -61 | ||||||||||
| - = No Data Reported; -- = Not Applicable; NA = Not Available; W = Withheld to avoid disclosure of individual company data. |
| Release Date: 4/30/2024 |
| Next Release Date: 5/31/2024 |