|
Download Data (XLS File) |
|
||||||||
|
||||||||
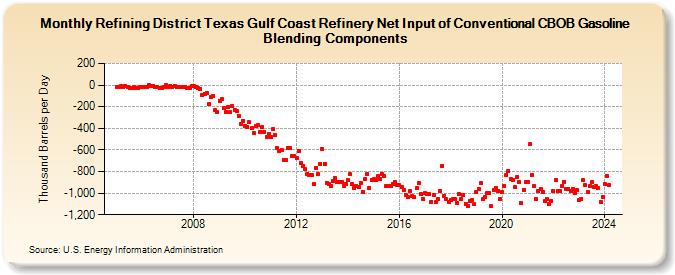
| Refining District Texas Gulf Coast Refinery Net Input of Conventional CBOB Gasoline Blending Components (Thousand Barrels per Day) | ||||||||
| Year | Jan | Feb | Mar | Apr | May | Jun | Jul | Aug | Sep | Oct | Nov | Dec |
|---|---|---|---|---|---|---|---|---|---|---|---|---|
| 2005 | -14 | -20 | -11 | -14 | -5 | -19 | -23 | -23 | -14 | -24 | -28 | -22 |
| 2006 | -15 | -15 | -14 | 0 | -7 | -5 | -14 | -20 | -23 | -23 | -16 | -3 |
| 2007 | -22 | -5 | -14 | -11 | -19 | -18 | -16 | -17 | -17 | -25 | -24 | -7 |
| 2008 | -10 | -18 | -25 | -33 | -89 | -80 | -77 | -176 | -114 | -103 | -235 | -252 |
| 2009 | -146 | -132 | -214 | -248 | -201 | -253 | -192 | -230 | -240 | -288 | -359 | -328 |
| 2010 | -376 | -386 | -346 | -395 | -446 | -377 | -373 | -431 | -390 | -432 | -478 | -453 |
| 2011 | -481 | -403 | -464 | -582 | -609 | -599 | -689 | -691 | -580 | -584 | -656 | -654 |
| 2012 | -679 | -611 | -719 | -750 | -780 | -823 | -836 | -832 | -915 | -766 | -821 | -729 |
| 2013 | -591 | -730 | -903 | -920 | -936 | -888 | -861 | -901 | -895 | -893 | -932 | -915 |
| 2014 | -882 | -826 | -915 | -953 | -936 | -939 | -906 | -986 | -869 | -827 | -950 | -879 |
| 2015 | -874 | -875 | -843 | -874 | -827 | -844 | -936 | -932 | -936 | -918 | -898 | -924 |
| 2016 | -926 | -948 | -974 | -1,014 | -1,038 | -985 | -1,029 | -1,040 | -957 | -909 | -1,008 | -1,059 |
| 2017 | -1,002 | -1,006 | -1,009 | -1,078 | -1,018 | -1,083 | -1,054 | -982 | -747 | -1,029 | -1,059 | -1,084 |
| 2018 | -1,064 | -1,053 | -1,059 | -1,096 | -1,012 | -1,056 | -1,014 | -1,097 | -1,121 | -1,069 | -1,063 | -1,105 |
| 2019 | -989 | -961 | -911 | -1,057 | -1,040 | -998 | -1,001 | -1,122 | -970 | -952 | -979 | -1,051 |
| 2020 | -990 | -932 | -829 | -794 | -869 | -883 | -945 | -849 | -901 | -1,092 | -973 | -900 |
| 2021 | -893 | -549 | -830 | -937 | -1,054 | -977 | -960 | -994 | -1,072 | -1,059 | -1,105 | -1,070 |
| 2022 | -977 | -877 | -976 | -985 | -932 | -898 | -966 | -959 | -976 | -965 | -1,000 | -972 |
| 2023 | -1,067 | -1,051 | -883 | -928 | -990 | -937 | -900 | -941 | -936 | -952 | -1,081 | -1,038 |
| 2024 | -916 | -842 | ||||||||||
| - = No Data Reported; -- = Not Applicable; NA = Not Available; W = Withheld to avoid disclosure of individual company data. |
| Release Date: 4/30/2024 |
| Next Release Date: 5/31/2024 |