|
Download Data (XLS File) |
|
||||||||
|
||||||||
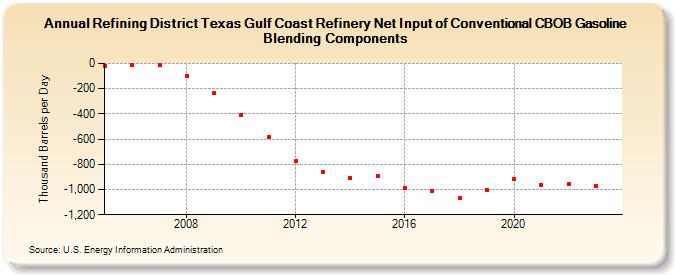
| Refining District Texas Gulf Coast Refinery Net Input of Conventional CBOB Gasoline Blending Components (Thousand Barrels per Day) | ||||||||
| Decade | Year-0 | Year-1 | Year-2 | Year-3 | Year-4 | Year-5 | Year-6 | Year-7 | Year-8 | Year-9 |
|---|---|---|---|---|---|---|---|---|---|---|
| 2000's | -18 | -13 | -16 | -101 | -236 | |||||
| 2010's | -407 | -584 | -772 | -864 | -906 | -890 | -991 | -1,013 | -1,067 | -1,003 |
| 2020's | -913 | -961 | -957 | -975 |
| - = No Data Reported; -- = Not Applicable; NA = Not Available; W = Withheld to avoid disclosure of individual company data. |
| Release Date: 4/30/2024 |
| Next Release Date: 8/30/2024 |