|
Download Data (XLS File) |
|
||||||||
|
||||||||
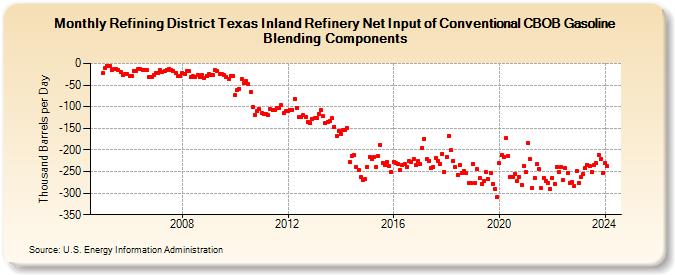
| Refining District Texas Inland Refinery Net Input of Conventional CBOB Gasoline Blending Components (Thousand Barrels per Day) | ||||||||
| Year | Jan | Feb | Mar | Apr | May | Jun | Jul | Aug | Sep | Oct | Nov | Dec |
|---|---|---|---|---|---|---|---|---|---|---|---|---|
| 2005 | -23 | -11 | -5 | -5 | -14 | -13 | -12 | -15 | -19 | -27 | -24 | -25 |
| 2006 | -30 | -28 | -17 | -17 | -12 | -13 | -14 | -15 | -16 | -31 | -32 | -27 |
| 2007 | -22 | -22 | -14 | -19 | -18 | -14 | -13 | -15 | -18 | -22 | -30 | -28 |
| 2008 | -21 | -24 | -18 | -18 | -32 | -30 | -32 | -27 | -31 | -27 | -33 | -28 |
| 2009 | -25 | -27 | -26 | -16 | -18 | -24 | -25 | -27 | -31 | -35 | -28 | -29 |
| 2010 | -73 | -62 | -58 | -36 | -45 | -41 | -48 | -66 | -101 | -119 | -110 | -106 |
| 2011 | -115 | -116 | -116 | -120 | -106 | -108 | -107 | -104 | -102 | -97 | -115 | -111 |
| 2012 | -110 | -107 | -107 | -82 | -102 | -125 | -123 | -120 | -125 | -135 | -138 | -129 |
| 2013 | -127 | -126 | -116 | -108 | -122 | -138 | -135 | -132 | -127 | -146 | -167 | -156 |
| 2014 | -164 | -153 | -154 | -150 | -228 | -213 | -211 | -240 | -247 | -263 | -269 | -268 |
| 2015 | -239 | -217 | -222 | -217 | -240 | -215 | -188 | -230 | -236 | -229 | -238 | -250 |
| 2016 | -227 | -230 | -232 | -246 | -236 | -233 | -239 | -225 | -229 | -222 | -235 | -226 |
| 2017 | -232 | -196 | -174 | -222 | -225 | -242 | -240 | -218 | -225 | -233 | -209 | -251 |
| 2018 | -216 | -167 | -201 | -225 | -239 | -257 | -236 | -253 | -248 | -253 | -276 | -277 |
| 2019 | -232 | -276 | -245 | -266 | -279 | -272 | -252 | -268 | -254 | -280 | -291 | -310 |
| 2020 | -231 | -211 | -216 | -173 | -214 | -263 | -262 | -255 | -272 | -262 | -281 | -237 |
| 2021 | -251 | -185 | -222 | -288 | -264 | -233 | -245 | -289 | -264 | -273 | -276 | -290 |
| 2022 | -265 | -278 | -239 | -250 | -239 | -270 | -243 | -254 | -277 | -275 | -284 | -249 |
| 2023 | -276 | -263 | -255 | -243 | -234 | -238 | -252 | -235 | -230 | -211 | -222 | -253 |
| 2024 | -230 | -238 | ||||||||||
| - = No Data Reported; -- = Not Applicable; NA = Not Available; W = Withheld to avoid disclosure of individual company data. |
| Release Date: 4/30/2024 |
| Next Release Date: 5/31/2024 |