|
Download Data (XLS File) |
|
||||||||
|
||||||||
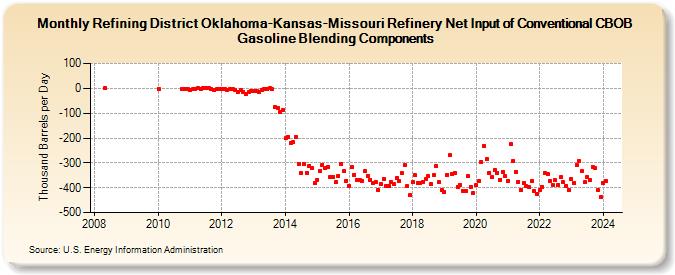
| Refining District Oklahoma-Kansas-Missouri Refinery Net Input of Conventional CBOB Gasoline Blending Components (Thousand Barrels per Day) | ||||||||
| Year | Jan | Feb | Mar | Apr | May | Jun | Jul | Aug | Sep | Oct | Nov | Dec |
|---|---|---|---|---|---|---|---|---|---|---|---|---|
| 2008 | 0 | |||||||||||
| 2010 | -2 | -1 | -2 | -3 | ||||||||
| 2011 | -5 | -4 | -1 | 1 | -2 | 1 | 0 | 1 | -2 | -6 | -4 | -4 |
| 2012 | -4 | -3 | -6 | -4 | -4 | -6 | -13 | -8 | -14 | -21 | -16 | -10 |
| 2013 | -12 | -9 | -13 | -5 | -1 | -3 | 0 | -4 | -77 | -78 | -94 | -88 |
| 2014 | -201 | -195 | -221 | -218 | -194 | -303 | -341 | -306 | -340 | -311 | -321 | -382 |
| 2015 | -367 | -332 | -307 | -320 | -317 | -358 | -355 | -379 | -353 | -303 | -332 | -371 |
| 2016 | -392 | -318 | -347 | -368 | -370 | -372 | -334 | -352 | -367 | -381 | -377 | -410 |
| 2017 | -385 | -365 | -393 | -395 | -378 | -387 | -359 | -374 | -342 | -309 | -395 | -431 |
| 2018 | -379 | -350 | -381 | -380 | -375 | -366 | -354 | -386 | -350 | -313 | -379 | -410 |
| 2019 | -418 | -347 | -270 | -345 | -341 | -396 | -388 | -412 | -412 | -354 | -396 | -422 |
| 2020 | -390 | -374 | -296 | -231 | -285 | -339 | -357 | -329 | -339 | -367 | -335 | -354 |
| 2021 | -372 | -226 | -292 | -335 | -376 | -410 | -381 | -394 | -399 | -372 | -414 | -424 |
| 2022 | -411 | -396 | -341 | -346 | -372 | -389 | -370 | -388 | -357 | -379 | -393 | -409 |
| 2023 | -365 | -381 | -308 | -294 | -333 | -379 | -356 | -370 | -315 | -322 | -411 | -439 |
| 2024 | -381 | -373 | ||||||||||
| - = No Data Reported; -- = Not Applicable; NA = Not Available; W = Withheld to avoid disclosure of individual company data. |
| Release Date: 4/30/2024 |
| Next Release Date: 5/31/2024 |