|
Download Data (XLS File) |
|
||||||||
|
||||||||
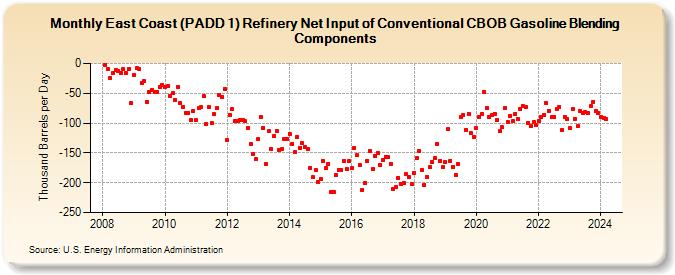
| East Coast (PADD 1) Refinery Net Input of Conventional CBOB Gasoline Blending Components (Thousand Barrels per Day) | ||||||||
| Year | Jan | Feb | Mar | Apr | May | Jun | Jul | Aug | Sep | Oct | Nov | Dec |
|---|---|---|---|---|---|---|---|---|---|---|---|---|
| 2008 | -2 | -10 | -24 | -16 | -11 | -13 | -16 | -10 | -16 | -9 | -67 | |
| 2009 | -19 | -8 | -9 | -33 | -29 | -65 | -48 | -44 | -47 | -47 | -40 | -36 |
| 2010 | -40 | -38 | -54 | -50 | -61 | -39 | -67 | -73 | -83 | -83 | -95 | -79 |
| 2011 | -95 | -75 | -73 | -55 | -101 | -73 | -100 | -85 | -75 | -53 | -56 | -42 |
| 2012 | -129 | -86 | -77 | -96 | -96 | -95 | -95 | -97 | -108 | -135 | -151 | -161 |
| 2013 | -127 | -89 | -108 | -168 | -114 | -144 | -122 | -113 | -145 | -144 | -127 | -126 |
| 2014 | -118 | -135 | -149 | -123 | -141 | -134 | -140 | -144 | -175 | -191 | -179 | -198 |
| 2015 | -194 | -164 | -176 | -168 | -215 | -215 | -187 | -179 | -179 | -163 | -177 | -164 |
| 2016 | -176 | -142 | -154 | -170 | -212 | -201 | -163 | -147 | -177 | -155 | -150 | -170 |
| 2017 | -162 | -156 | -157 | -168 | -211 | -207 | -192 | -202 | -200 | -186 | -191 | -202 |
| 2018 | -183 | -159 | -147 | -178 | -203 | -190 | -174 | -165 | -159 | -135 | -163 | -174 |
| 2019 | -165 | -110 | -163 | -173 | -187 | -168 | -90 | -87 | -111 | -84 | -117 | -123 |
| 2020 | -109 | -89 | -85 | -47 | -75 | -89 | -86 | -84 | -94 | -114 | -107 | -75 |
| 2021 | -98 | -88 | -96 | -84 | -93 | -77 | -72 | -73 | -99 | -105 | -98 | -103 |
| 2022 | -96 | -90 | -87 | -67 | -79 | -90 | -89 | -76 | -73 | -111 | -89 | -93 |
| 2023 | -109 | -77 | -93 | -105 | -79 | -83 | -81 | -83 | -72 | -64 | -80 | -83 |
| 2024 | -89 | -91 | ||||||||||
| - = No Data Reported; -- = Not Applicable; NA = Not Available; W = Withheld to avoid disclosure of individual company data. |
| Release Date: 4/30/2024 |
| Next Release Date: 5/31/2024 |