|
Download Data (XLS File) |
|
||||||||
|
||||||||
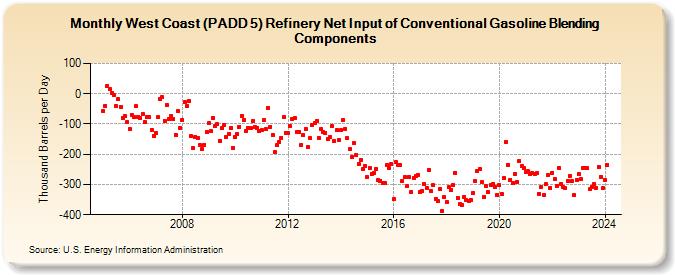
| West Coast (PADD 5) Refinery Net Input of Conventional Gasoline Blending Components (Thousand Barrels per Day) | ||||||||
| Year | Jan | Feb | Mar | Apr | May | Jun | Jul | Aug | Sep | Oct | Nov | Dec |
|---|---|---|---|---|---|---|---|---|---|---|---|---|
| 2005 | -57 | -39 | 25 | 16 | 4 | -4 | -41 | -19 | -43 | -79 | -74 | -95 |
| 2006 | -117 | -70 | -78 | -42 | -76 | -81 | -68 | -93 | -78 | -77 | -119 | -139 |
| 2007 | -130 | -78 | -19 | -12 | -89 | -38 | -84 | -73 | -83 | -136 | -58 | -113 |
| 2008 | -86 | -29 | -42 | -23 | -139 | -181 | -142 | -145 | -171 | -183 | -168 | -128 |
| 2009 | -98 | -124 | -79 | -108 | -101 | -155 | -114 | -104 | -142 | -133 | -114 | -178 |
| 2010 | -142 | -132 | -109 | -72 | -87 | -123 | -114 | -114 | -90 | -110 | -113 | -124 |
| 2011 | -120 | -88 | -117 | -47 | -109 | -135 | -194 | -171 | -160 | -145 | -77 | -129 |
| 2012 | -130 | -107 | -83 | -79 | -127 | -125 | -168 | -137 | -115 | -176 | -147 | -102 |
| 2013 | -96 | -89 | -147 | -116 | -127 | -129 | -151 | -143 | -107 | -157 | -121 | -153 |
| 2014 | -121 | -86 | -115 | -148 | -184 | -210 | -163 | -202 | -232 | -218 | -249 | -238 |
| 2015 | -276 | -247 | -265 | -261 | -248 | -286 | -287 | -295 | -296 | -236 | -247 | -231 |
| 2016 | -349 | -227 | -234 | -236 | -289 | -276 | -306 | -275 | -325 | -277 | -272 | -268 |
| 2017 | -324 | -321 | -300 | -311 | -251 | -323 | -303 | -347 | -355 | -315 | -387 | -342 |
| 2018 | -359 | -310 | -319 | -302 | -261 | -344 | -365 | -369 | -341 | -352 | -354 | -352 |
| 2019 | -329 | -290 | -255 | -250 | -293 | -342 | -306 | -326 | -301 | -297 | -308 | -334 |
| 2020 | -302 | -331 | -279 | -158 | -234 | -284 | -295 | -264 | -291 | -223 | -239 | -247 |
| 2021 | -259 | -257 | -267 | -262 | -267 | -263 | -330 | -307 | -335 | -300 | -269 | -311 |
| 2022 | -261 | -281 | -305 | -244 | -297 | -308 | -313 | -289 | -271 | -290 | -335 | -284 |
| 2023 | -265 | -282 | -245 | -246 | -246 | -316 | -307 | -299 | -312 | -241 | -275 | -311 |
| 2024 | -286 | -235 | ||||||||||
| - = No Data Reported; -- = Not Applicable; NA = Not Available; W = Withheld to avoid disclosure of individual company data. |
| Release Date: 4/30/2024 |
| Next Release Date: 5/31/2024 |