|
Download Data (XLS File) |
|
||||||||
|
||||||||
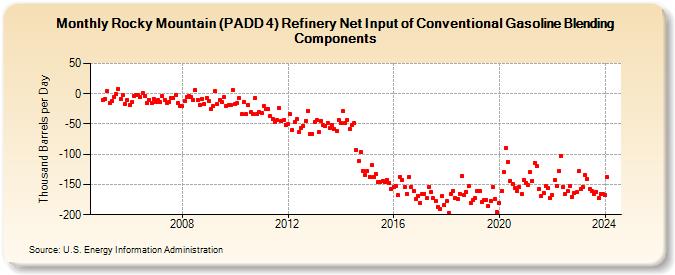
| Rocky Mountain (PADD 4) Refinery Net Input of Conventional Gasoline Blending Components (Thousand Barrels per Day) | ||||||||
| Year | Jan | Feb | Mar | Apr | May | Jun | Jul | Aug | Sep | Oct | Nov | Dec |
|---|---|---|---|---|---|---|---|---|---|---|---|---|
| 2005 | -11 | -8 | 4 | -15 | -12 | -5 | 0 | 8 | -8 | -2 | -17 | -10 |
| 2006 | -19 | -14 | -4 | -2 | -2 | -5 | 1 | -4 | -16 | -10 | -15 | -8 |
| 2007 | -13 | -11 | -14 | -4 | -10 | -16 | -13 | -7 | -7 | -2 | -16 | -21 |
| 2008 | -21 | -12 | -6 | -4 | -6 | -11 | 6 | -10 | -19 | -8 | -17 | -7 |
| 2009 | -12 | -26 | -21 | 4 | -17 | -10 | -14 | -6 | -21 | -19 | -18 | 6 |
| 2010 | -17 | -15 | -7 | -34 | -14 | -34 | -19 | -31 | -33 | -7 | -33 | -31 |
| 2011 | -32 | -21 | -25 | -25 | -37 | -42 | -46 | -44 | -24 | -45 | -44 | -51 |
| 2012 | -50 | -34 | -60 | -47 | -42 | -63 | -56 | -53 | -45 | -28 | -67 | -66 |
| 2013 | -46 | -43 | -63 | -45 | -52 | -53 | -48 | -56 | -51 | -59 | -61 | -43 |
| 2014 | -49 | -29 | -49 | -43 | -59 | -51 | -49 | -93 | -111 | -96 | -127 | -134 |
| 2015 | -128 | -137 | -118 | -137 | -133 | -146 | -146 | -144 | -146 | -142 | -147 | -157 |
| 2016 | -154 | -152 | -168 | -137 | -142 | -154 | -165 | -137 | -154 | -160 | -174 | -169 |
| 2017 | -181 | -166 | -165 | -173 | -154 | -162 | -173 | -178 | -187 | -190 | -169 | -184 |
| 2018 | -177 | -197 | -165 | -160 | -172 | -174 | -165 | -136 | -167 | -162 | -153 | -180 |
| 2019 | -176 | -172 | -160 | -160 | -179 | -176 | -175 | -186 | -177 | -154 | -174 | -196 |
| 2020 | -180 | -161 | -130 | -89 | -113 | -144 | -150 | -156 | -160 | -154 | -166 | -142 |
| 2021 | -147 | -151 | -130 | -145 | -114 | -120 | -157 | -169 | -164 | -153 | -156 | -172 |
| 2022 | -168 | -143 | -152 | -127 | -103 | -154 | -165 | -161 | -153 | -170 | -164 | -163 |
| 2023 | -128 | -158 | -154 | -135 | -141 | -157 | -161 | -166 | -162 | -173 | -165 | -166 |
| 2024 | -168 | -138 | ||||||||||
| - = No Data Reported; -- = Not Applicable; NA = Not Available; W = Withheld to avoid disclosure of individual company data. |
| Release Date: 4/30/2024 |
| Next Release Date: 5/31/2024 |