|
Download Data (XLS File) |
|
||||||||
|
||||||||
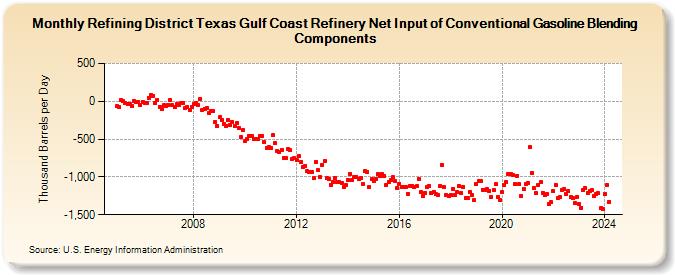
| Refining District Texas Gulf Coast Refinery Net Input of Conventional Gasoline Blending Components (Thousand Barrels per Day) | ||||||||
| Year | Jan | Feb | Mar | Apr | May | Jun | Jul | Aug | Sep | Oct | Nov | Dec |
|---|---|---|---|---|---|---|---|---|---|---|---|---|
| 2005 | -68 | -79 | 19 | 1 | -23 | -35 | -35 | -57 | 7 | -8 | -9 | -53 |
| 2006 | -9 | -17 | -22 | 47 | 89 | 76 | -29 | 16 | -71 | -97 | -54 | -58 |
| 2007 | -46 | 16 | -53 | -76 | -42 | -51 | -23 | -25 | -89 | -81 | -118 | -73 |
| 2008 | -41 | -26 | -50 | 31 | -118 | -96 | -87 | -158 | -122 | -135 | -271 | -326 |
| 2009 | -213 | -242 | -301 | -322 | -249 | -314 | -277 | -324 | -290 | -348 | -469 | -381 |
| 2010 | -527 | -495 | -453 | -457 | -501 | -495 | -497 | -462 | -456 | -542 | -618 | -608 |
| 2011 | -614 | -450 | -554 | -657 | -670 | -644 | -744 | -754 | -635 | -649 | -757 | -754 |
| 2012 | -783 | -721 | -807 | -868 | -851 | -927 | -940 | -941 | -1,021 | -805 | -915 | -1,001 |
| 2013 | -840 | -792 | -1,012 | -1,027 | -1,107 | -1,069 | -1,009 | -1,072 | -1,071 | -1,079 | -1,135 | -1,108 |
| 2014 | -1,042 | -957 | -1,042 | -1,004 | -996 | -1,028 | -1,014 | -1,096 | -922 | -931 | -1,133 | -1,031 |
| 2015 | -1,054 | -1,025 | -965 | -992 | -961 | -990 | -1,105 | -1,069 | -1,047 | -1,005 | -1,058 | -1,146 |
| 2016 | -1,089 | -1,133 | -1,127 | -1,134 | -1,221 | -1,116 | -1,123 | -1,133 | -1,121 | -1,029 | -1,203 | -1,247 |
| 2017 | -1,212 | -1,135 | -1,118 | -1,213 | -1,197 | -1,232 | -1,234 | -1,117 | -842 | -1,140 | -1,239 | -1,256 |
| 2018 | -1,235 | -1,163 | -1,238 | -1,200 | -1,124 | -1,215 | -1,134 | -1,278 | -1,283 | -1,197 | -1,242 | -1,311 |
| 2019 | -1,095 | -1,058 | -1,055 | -1,168 | -1,172 | -1,164 | -1,182 | -1,260 | -1,173 | -1,095 | -1,261 | -1,299 |
| 2020 | -1,206 | -1,109 | -1,066 | -965 | -962 | -972 | -1,090 | -984 | -1,094 | -1,253 | -1,158 | -1,099 |
| 2021 | -1,078 | -606 | -946 | -1,146 | -1,217 | -1,106 | -1,073 | -1,208 | -1,243 | -1,226 | -1,354 | -1,338 |
| 2022 | -1,190 | -1,105 | -1,281 | -1,271 | -1,168 | -1,159 | -1,221 | -1,187 | -1,270 | -1,285 | -1,349 | -1,260 |
| 2023 | -1,363 | -1,407 | -1,169 | -1,152 | -1,212 | -1,190 | -1,174 | -1,256 | -1,222 | -1,218 | -1,417 | -1,424 |
| 2024 | -1,223 | -1,108 | ||||||||||
| - = No Data Reported; -- = Not Applicable; NA = Not Available; W = Withheld to avoid disclosure of individual company data. |
| Release Date: 4/30/2024 |
| Next Release Date: 5/31/2024 |