|
Download Data (XLS File) |
|
||||||||
|
||||||||
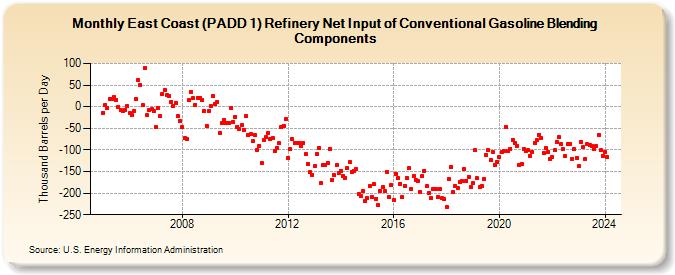
| East Coast (PADD 1) Refinery Net Input of Conventional Gasoline Blending Components (Thousand Barrels per Day) | ||||||||
| Year | Jan | Feb | Mar | Apr | May | Jun | Jul | Aug | Sep | Oct | Nov | Dec |
|---|---|---|---|---|---|---|---|---|---|---|---|---|
| 2005 | -14 | 5 | -3 | 18 | 17 | 23 | 16 | 0 | -8 | -10 | -7 | 1 |
| 2006 | -15 | -20 | -10 | 18 | 62 | 50 | 3 | 89 | -20 | -8 | -6 | -11 |
| 2007 | -48 | -2 | -22 | 29 | 39 | 26 | 25 | 12 | 2 | 9 | -22 | -32 |
| 2008 | -48 | -73 | -74 | 15 | 34 | 19 | 4 | 21 | 21 | 15 | -11 | -44 |
| 2009 | -11 | 1 | 25 | 7 | 12 | -60 | -38 | -30 | -38 | -37 | -3 | -35 |
| 2010 | -23 | -46 | -52 | -43 | -53 | -22 | -66 | -64 | -80 | -66 | -100 | -90 |
| 2011 | -130 | -77 | -71 | -60 | -75 | -73 | -103 | -95 | -85 | -47 | -44 | -28 |
| 2012 | -118 | -99 | -75 | -84 | -84 | -83 | -92 | -84 | -109 | -133 | -152 | -157 |
| 2013 | -138 | -109 | -95 | -177 | -134 | -136 | -130 | -97 | -170 | -159 | -136 | -154 |
| 2014 | -148 | -160 | -164 | -142 | -128 | -150 | -149 | -144 | -202 | -206 | -196 | -219 |
| 2015 | -212 | -183 | -208 | -179 | -213 | -228 | -195 | -187 | -196 | -151 | -210 | -182 |
| 2016 | -216 | -155 | -166 | -178 | -210 | -183 | -165 | -142 | -190 | -160 | -169 | -173 |
| 2017 | -198 | -160 | -148 | -184 | -199 | -211 | -190 | -191 | -209 | -190 | -212 | -214 |
| 2018 | -232 | -168 | -140 | -198 | -184 | -188 | -174 | -172 | -144 | -171 | -162 | -185 |
| 2019 | -177 | -101 | -166 | -187 | -183 | -167 | -111 | -101 | -124 | -105 | -136 | -127 |
| 2020 | -117 | -104 | -102 | -46 | -102 | -97 | -76 | -84 | -90 | -136 | -132 | -97 |
| 2021 | -102 | -101 | -113 | -104 | -83 | -78 | -65 | -73 | -107 | -95 | -104 | -120 |
| 2022 | -116 | -101 | -82 | -71 | -87 | -98 | -115 | -86 | -86 | -120 | -99 | -118 |
| 2023 | -137 | -82 | -94 | -122 | -87 | -89 | -91 | -97 | -92 | -66 | -101 | -113 |
| 2024 | -104 | -117 | ||||||||||
| - = No Data Reported; -- = Not Applicable; NA = Not Available; W = Withheld to avoid disclosure of individual company data. |
| Release Date: 4/30/2024 |
| Next Release Date: 5/31/2024 |