|
Download Data (XLS File) |
|
||||||||
|
||||||||
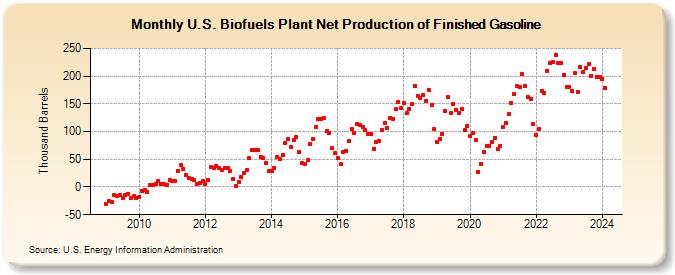
| U.S. Biofuels Plant Net Production of Finished Gasoline (Thousand Barrels) | ||||||||
| Year | Jan | Feb | Mar | Apr | May | Jun | Jul | Aug | Sep | Oct | Nov | Dec |
|---|---|---|---|---|---|---|---|---|---|---|---|---|
| 2009 | -30 | -26 | -27 | -14 | -16 | -15 | -19 | -14 | -12 | -19 | -17 | -19 |
| 2010 | -18 | -8 | -5 | -9 | 4 | 4 | 6 | 10 | 6 | 5 | 4 | 12 |
| 2011 | 11 | 10 | 28 | 39 | 33 | 22 | 16 | 14 | 12 | 5 | 7 | 10 |
| 2012 | 5 | 12 | 36 | 35 | 38 | 35 | 31 | 35 | 35 | 29 | 15 | 1 |
| 2013 | 9 | 18 | 25 | 31 | 52 | 66 | 67 | 67 | 55 | 52 | 43 | 28 |
| 2014 | 29 | 35 | 55 | 51 | 58 | 79 | 86 | 72 | 85 | 90 | 64 | 44 |
| 2015 | 42 | 49 | 78 | 86 | 109 | 122 | 122 | 124 | 101 | 97 | 71 | 61 |
| 2016 | 53 | 41 | 64 | 65 | 83 | 105 | 98 | 113 | 112 | 109 | 102 | 95 |
| 2017 | 95 | 69 | 81 | 83 | 103 | 115 | 107 | 124 | 123 | 140 | 154 | 142 |
| 2018 | 151 | 133 | 141 | 149 | 183 | 165 | 161 | 166 | 156 | 175 | 148 | 104 |
| 2019 | 82 | 86 | 96 | 137 | 162 | 133 | 150 | 139 | 133 | 141 | 102 | 110 |
| 2020 | 92 | 98 | 84 | 27 | 41 | 64 | 74 | 74 | 82 | 89 | 68 | 74 |
| 2021 | 108 | 116 | 131 | 151 | 167 | 183 | 180 | 203 | 183 | 163 | 158 | 113 |
| 2022 | 94 | 105 | 174 | 169 | 210 | 224 | 226 | 238 | 224 | 224 | 202 | 181 |
| 2023 | 181 | 181 | 215 | 180 | 217 | 208 | 214 | 221 | 201 | 213 | 198 | 198 |
| 2024 | 194 | 179 | 193 | 221 | 235 | 196 | ||||||
| - = No Data Reported; -- = Not Applicable; NA = Not Available; W = Withheld to avoid disclosure of individual company data. |
| Release Date: 8/30/2024 |
| Next Release Date: 9/30/2024 |