|
Download Data (XLS File) |
|
||||||||
|
||||||||
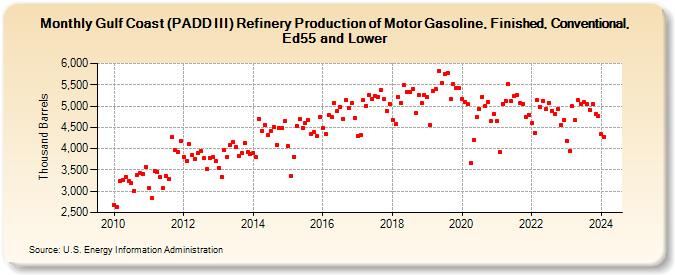
| Gulf Coast (PADD III) Refinery Production of Motor Gasoline, Finished, Conventional, Ed55 and Lower (Thousand Barrels) | ||||||||
| Year | Jan | Feb | Mar | Apr | May | Jun | Jul | Aug | Sep | Oct | Nov | Dec |
|---|---|---|---|---|---|---|---|---|---|---|---|---|
| 2010 | 2,686 | 2,631 | 3,233 | 3,271 | 3,342 | 3,233 | 3,184 | 3,013 | 3,391 | 3,424 | 3,407 | 3,574 |
| 2011 | 3,073 | 2,833 | 3,471 | 3,457 | 3,332 | 3,075 | 3,347 | 3,281 | 4,275 | 3,969 | 3,917 | 4,174 |
| 2012 | 3,811 | 3,712 | 4,103 | 3,862 | 3,749 | 3,904 | 3,939 | 3,778 | 3,521 | 3,790 | 3,803 | 3,709 |
| 2013 | 3,555 | 3,341 | 3,980 | 3,807 | 4,091 | 4,158 | 4,033 | 3,822 | 3,895 | 4,130 | 3,914 | 3,875 |
| 2014 | 3,903 | 3,798 | 4,696 | 4,424 | 4,550 | 4,317 | 4,417 | 4,499 | 4,095 | 4,482 | 4,487 | 4,638 |
| 2015 | 4,061 | 3,365 | 3,811 | 4,539 | 4,687 | 4,496 | 4,610 | 4,671 | 4,346 | 4,383 | 4,289 | 4,751 |
| 2016 | 4,495 | 4,339 | 4,788 | 4,733 | 5,068 | 4,877 | 4,988 | 4,705 | 5,136 | 4,963 | 5,067 | 4,716 |
| 2017 | 4,291 | 4,321 | 5,137 | 5,009 | 5,260 | 5,175 | 5,234 | 5,220 | 5,374 | 5,164 | 4,881 | 5,044 |
| 2018 | 4,674 | 4,570 | 5,215 | 5,080 | 5,499 | 5,327 | 5,326 | 5,403 | 4,833 | 5,262 | 5,077 | 5,263 |
| 2019 | 5,215 | 4,560 | 5,359 | 5,395 | 5,835 | 5,541 | 5,761 | 5,784 | 5,169 | 5,519 | 5,420 | 5,416 |
| 2020 | 5,172 | 5,096 | 5,044 | 3,665 | 4,205 | 4,734 | 4,943 | 5,224 | 4,996 | 5,086 | 4,646 | 4,822 |
| 2021 | 4,653 | 3,919 | 5,055 | 5,122 | 5,524 | 5,112 | 5,248 | 5,268 | 5,061 | 5,055 | 4,743 | 4,785 |
| 2022 | 4,596 | 4,374 | 5,152 | 4,980 | 5,119 | 4,922 | 5,083 | 4,881 | 4,815 | 4,934 | 4,560 | 4,683 |
| 2023 | 4,177 | 3,948 | 4,994 | 4,673 | 5,136 | 5,049 | 5,094 | 5,041 | 4,919 | 5,049 | 4,813 | 4,765 |
| 2024 | 4,339 | |||||||||||
| - = No Data Reported; -- = Not Applicable; NA = Not Available; W = Withheld to avoid disclosure of individual company data. |
| Release Date: 3/29/2024 |
| Next Release Date: 4/30/2024 |