|
Download Data (XLS File) |
|
||||||||
|
||||||||
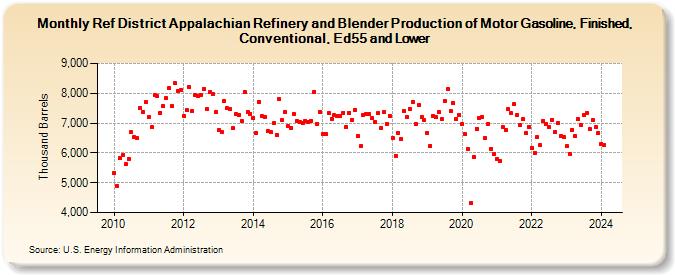
| Ref District Appalachian Refinery and Blender Production of Motor Gasoline, Finished, Conventional, Ed55 and Lower (Thousand Barrels) | ||||||||
| Year | Jan | Feb | Mar | Apr | May | Jun | Jul | Aug | Sep | Oct | Nov | Dec |
|---|---|---|---|---|---|---|---|---|---|---|---|---|
| 2010 | 5,323 | 4,892 | 5,814 | 5,915 | 5,624 | 5,796 | 6,688 | 6,522 | 6,492 | 7,499 | 7,374 | 7,707 |
| 2011 | 7,206 | 6,858 | 7,939 | 7,898 | 7,352 | 7,568 | 7,829 | 8,161 | 7,560 | 8,334 | 8,083 | 8,114 |
| 2012 | 7,222 | 7,438 | 8,205 | 7,396 | 7,952 | 7,912 | 7,941 | 8,155 | 7,468 | 8,030 | 7,962 | 7,365 |
| 2013 | 6,760 | 6,704 | 7,741 | 7,496 | 7,474 | 6,830 | 7,313 | 7,279 | 7,070 | 8,049 | 7,370 | 7,315 |
| 2014 | 7,172 | 6,685 | 7,714 | 7,229 | 7,193 | 6,742 | 6,709 | 6,991 | 6,612 | 7,794 | 7,091 | 7,385 |
| 2015 | 6,900 | 6,833 | 7,307 | 7,079 | 7,037 | 7,012 | 7,086 | 7,037 | 7,078 | 8,052 | 6,975 | 7,379 |
| 2016 | 6,648 | 6,644 | 7,331 | 7,148 | 7,259 | 7,234 | 7,248 | 7,350 | 6,875 | 7,355 | 7,113 | 7,456 |
| 2017 | 6,578 | 6,231 | 7,270 | 7,301 | 7,298 | 7,171 | 7,047 | 7,324 | 6,843 | 7,369 | 6,971 | 7,240 |
| 2018 | 6,507 | 5,900 | 6,680 | 6,454 | 7,407 | 7,198 | 7,481 | 7,715 | 6,973 | 7,604 | 7,210 | 7,089 |
| 2019 | 6,669 | 6,241 | 7,254 | 7,190 | 7,381 | 7,133 | 7,746 | 8,139 | 7,392 | 7,681 | 7,142 | 7,276 |
| 2020 | 6,968 | 6,626 | 6,135 | 4,316 | 5,877 | 6,816 | 7,167 | 7,201 | 6,498 | 6,977 | 6,144 | 5,960 |
| 2021 | 5,806 | 5,736 | 6,855 | 6,781 | 7,471 | 7,324 | 7,625 | 7,285 | 6,920 | 7,126 | 6,652 | 6,878 |
| 2022 | 6,171 | 6,006 | 6,519 | 6,256 | 7,086 | 6,970 | 6,879 | 7,119 | 6,705 | 7,005 | 6,573 | 6,545 |
| 2023 | 6,217 | 5,977 | 6,779 | 6,568 | 7,137 | 6,937 | 7,269 | 7,333 | 6,804 | 7,099 | 6,861 | 6,660 |
| 2024 | 6,308 | |||||||||||
| - = No Data Reported; -- = Not Applicable; NA = Not Available; W = Withheld to avoid disclosure of individual company data. |
| Release Date: 3/29/2024 |
| Next Release Date: 4/30/2024 |