|
Download Data (XLS File) |
|
||||||||
|
||||||||
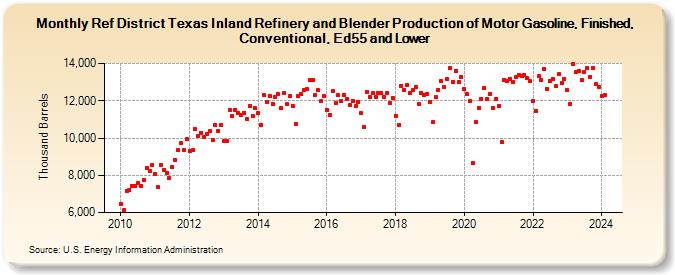
| Ref District Texas Inland Refinery and Blender Production of Motor Gasoline, Finished, Conventional, Ed55 and Lower (Thousand Barrels) | ||||||||
| Year | Jan | Feb | Mar | Apr | May | Jun | Jul | Aug | Sep | Oct | Nov | Dec |
|---|---|---|---|---|---|---|---|---|---|---|---|---|
| 2010 | 6,479 | 6,121 | 7,161 | 7,229 | 7,441 | 7,447 | 7,561 | 7,421 | 7,734 | 8,412 | 8,244 | 8,561 |
| 2011 | 8,050 | 7,349 | 8,555 | 8,263 | 8,108 | 7,852 | 8,447 | 8,799 | 9,352 | 9,709 | 9,380 | 9,933 |
| 2012 | 9,326 | 9,343 | 10,458 | 10,106 | 10,295 | 10,076 | 10,214 | 10,355 | 9,920 | 10,696 | 10,377 | 10,711 |
| 2013 | 9,821 | 9,817 | 11,528 | 11,166 | 11,492 | 11,333 | 11,213 | 11,366 | 10,999 | 11,719 | 11,185 | 11,585 |
| 2014 | 11,339 | 10,711 | 12,289 | 11,954 | 12,267 | 11,837 | 12,177 | 12,360 | 11,617 | 12,405 | 11,811 | 12,241 |
| 2015 | 11,722 | 10,768 | 12,278 | 12,347 | 12,585 | 12,620 | 13,101 | 13,088 | 12,332 | 12,559 | 11,999 | 12,248 |
| 2016 | 11,497 | 11,260 | 12,522 | 11,901 | 12,294 | 12,013 | 12,333 | 12,087 | 11,762 | 11,995 | 11,703 | 11,941 |
| 2017 | 11,319 | 10,602 | 12,493 | 12,205 | 12,391 | 12,210 | 12,422 | 12,393 | 12,210 | 12,390 | 11,867 | 12,151 |
| 2018 | 11,196 | 10,681 | 12,811 | 12,587 | 12,819 | 12,413 | 12,563 | 12,750 | 11,839 | 12,441 | 12,310 | 12,382 |
| 2019 | 11,957 | 10,850 | 12,207 | 12,599 | 13,036 | 12,760 | 13,167 | 13,735 | 13,030 | 13,595 | 13,002 | 13,286 |
| 2020 | 12,620 | 12,347 | 11,985 | 8,664 | 10,875 | 11,611 | 12,115 | 12,662 | 12,089 | 12,388 | 11,633 | 12,113 |
| 2021 | 11,699 | 9,761 | 13,125 | 13,058 | 13,186 | 12,983 | 13,265 | 13,358 | 13,339 | 13,405 | 13,214 | 13,046 |
| 2022 | 12,010 | 11,435 | 13,325 | 13,101 | 13,721 | 12,625 | 13,042 | 13,155 | 12,810 | 13,423 | 12,942 | 13,181 |
| 2023 | 12,478 | 11,835 | 13,883 | 13,537 | 13,585 | 12,985 | 13,553 | 13,771 | 13,257 | 13,775 | 12,919 | 12,861 |
| 2024 | 12,268 | 12,290 | 13,544 | 13,064 | 13,613 | 13,011 | ||||||
| - = No Data Reported; -- = Not Applicable; NA = Not Available; W = Withheld to avoid disclosure of individual company data. |
| Release Date: 8/30/2024 |
| Next Release Date: 9/30/2024 |