|
Download Data (XLS File) |
|
||||||||
|
||||||||
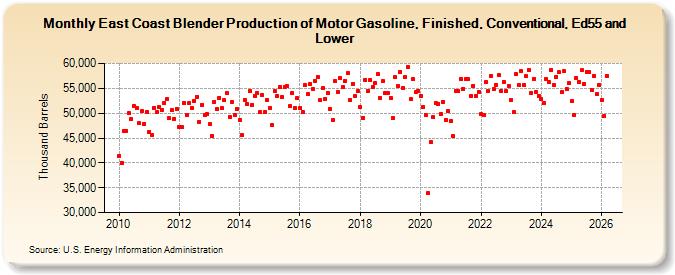
| East Coast Blender Production of Motor Gasoline, Finished, Conventional, Ed55 and Lower (Thousand Barrels) | ||||||||
| Year | Jan | Feb | Mar | Apr | May | Jun | Jul | Aug | Sep | Oct | Nov | Dec |
|---|---|---|---|---|---|---|---|---|---|---|---|---|
| 2010 | 41,426 | 40,048 | 46,513 | 46,457 | 49,970 | 48,804 | 51,482 | 51,031 | 47,946 | 50,389 | 47,913 | 50,267 |
| 2011 | 46,251 | 45,567 | 51,081 | 50,174 | 51,295 | 50,705 | 52,080 | 52,759 | 48,962 | 50,615 | 48,867 | 50,891 |
| 2012 | 47,258 | 47,202 | 52,138 | 49,721 | 52,062 | 50,947 | 52,479 | 53,315 | 48,275 | 51,731 | 49,682 | 49,749 |
| 2013 | 47,723 | 45,480 | 52,334 | 50,791 | 53,154 | 50,960 | 52,575 | 53,991 | 49,294 | 52,271 | 49,585 | 50,895 |
| 2014 | 48,697 | 45,580 | 52,749 | 51,819 | 54,393 | 51,690 | 53,510 | 54,154 | 50,137 | 53,636 | 50,224 | 52,635 |
| 2015 | 51,101 | 47,599 | 54,424 | 53,461 | 55,243 | 53,291 | 55,299 | 55,468 | 51,400 | 54,027 | 50,990 | 52,965 |
| 2016 | 50,945 | 50,265 | 55,620 | 53,837 | 55,799 | 54,903 | 56,559 | 57,257 | 52,590 | 55,039 | 52,948 | 54,075 |
| 2017 | 50,841 | 48,678 | 56,505 | 54,356 | 57,067 | 55,185 | 56,499 | 58,069 | 52,649 | 55,934 | 53,365 | 54,444 |
| 2018 | 51,253 | 49,104 | 56,774 | 54,506 | 56,655 | 55,266 | 56,059 | 57,838 | 53,017 | 56,433 | 54,087 | 54,004 |
| 2019 | 53,030 | 49,107 | 57,212 | 55,481 | 58,279 | 55,080 | 57,192 | 59,241 | 52,808 | 56,785 | 54,172 | 54,539 |
| 2020 | 53,406 | 51,165 | 49,667 | 33,912 | 44,190 | 49,167 | 52,013 | 51,858 | 49,862 | 52,278 | 48,727 | 50,337 |
| 2021 | 48,427 | 45,307 | 54,511 | 54,481 | 56,896 | 54,924 | 56,875 | 56,861 | 53,370 | 55,537 | 53,525 | 54,272 |
| 2022 | 49,766 | 49,594 | 56,282 | 54,443 | 57,496 | 54,834 | 55,733 | 57,657 | 54,538 | 56,350 | 54,399 | 55,475 |
| 2023 | 52,541 | 50,056 | 57,683 | 55,449 | 58,323 | 55,725 | 57,451 | 58,776 | 54,034 | 56,881 | 54,314 | 53,360 |
| 2024 | 52,704 | |||||||||||
| - = No Data Reported; -- = Not Applicable; NA = Not Available; W = Withheld to avoid disclosure of individual company data. |
| Release Date: 3/29/2024 |
| Next Release Date: 4/30/2024 |